
First QoS Measurement with Qosium
This tutorial demonstrates how to perform a minimalistic Quality of Service measurement with Qosium, using two Probes and Scope. Learning how to carry out QoS measurements with Qosium is essential, as QoS parameters are often the focus point when studying the performance of a real application.
Contents
1. Introduction #
Quality of Service measurement means measuring parameters such as delay, jitter, and packet loss. For this type of measurement, two Qosium Probes are needed. In addition to QoS measurement, we’ll also take a look at packet filters, and learn how to utilize multiple dashboards.
This tutorial is built on top of First Measurement With Qosium. It is highly recommended to read it before proceeding.
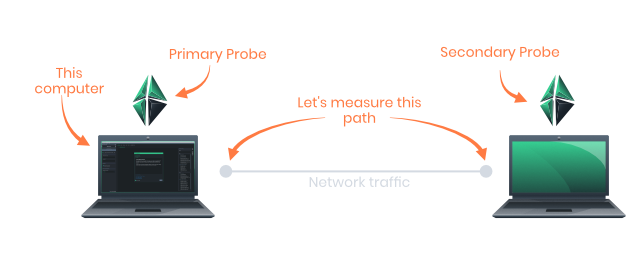
In this tutorial, we have one Probe installed on the same computer where Scope is running, and another Probe on a remote computer at address 192.168.1.236. The goal is to measure the network path between these two computers.
2. Preparation #
Before proceeding any further, we need to do some preparations for this tutorial. For a QoS measurement with Qosium, we need and actual application to measure. Since this is a quick tutorial, we won’t setup a real application. Instead, we generate artificial traffic between the two computers by using ping.
Ping is already installed in most computers. It also works the same way in most operating systems. First, open a console window in one of the computers. Type ping [address], where address is the IP address of the other computer. In this tutorial, our remote computer is at 192.168.1.236, and therefore we type ping 192.168.1.236. Now we have a continuous traffic flow between the computers, which can be measured.
 In Windows, ping only sends four packets and then stops. To ping continuously, type ping 192.168.1.236 -t
To make things more clear, let’s draw a measurement topology diagram. This diagram contains essentially all the information we need to run this measurement. The diagram shows the network path we are going to measure, the involved devices, and the involved capture interfaces. Since we are going to measure specific traffic, we also need to define a packet filter.
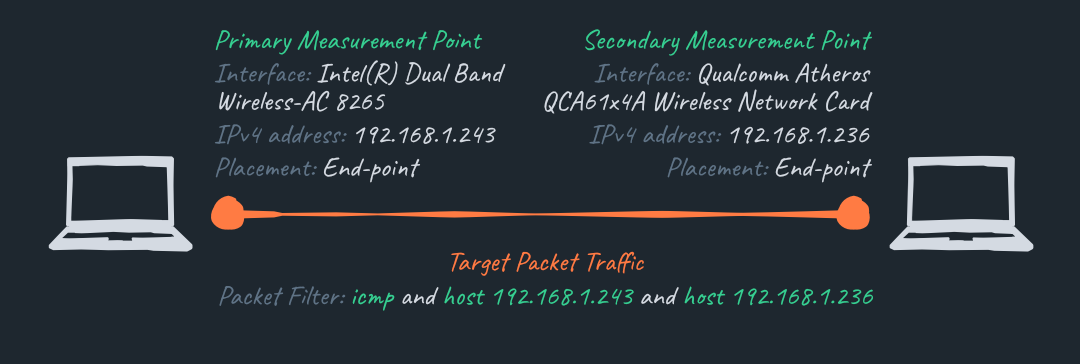
There can be—and most likely are—other packets traversing in and out of the involved interfaces than just our ping packets, and we want to exclude those from the measurement. This is where the packet filter comes into play.
Ping operates on ICMP protocol, so filtering out everything else except ICMP traffic will yield the results we want as long as no other ICMP traffic is traversing our measurement path. However, if there were another ICMP operation ongoing in one of our scenario’s computer’s, the measurement would give incorrect results. Thus, we add also the IP addresses of the computers to the filter, just in case. The filter then becomes: icmp and host 192.168.1.243 and host 192.168.1.236. This way we can be sure that only ICMP traffic between our two computers will be included in the measured traffic.
Install and launch Qosium Probes on both of these computers if you haven’t already, and continue to the next section.
If Scope is already running, select File->New Measurement before starting this exercise3. Setup Probes #
As in the previous tutorial, navigate to the Probes tab and fill out measurement info. But this time, we select Two-point measurement instead, which opens up the Secondary Measurement Point group. This is our remote computer, so we type the IP address 192.168.1.236 into the Hostname field. Our primary point is still in localhost, since we are running Scope in the same computer.
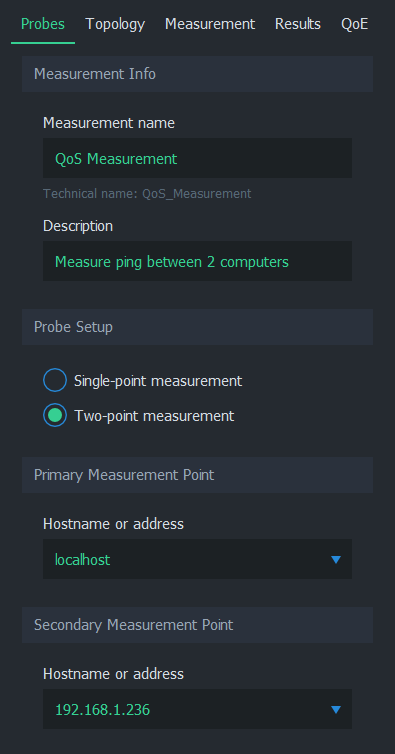
That’s all for Probe setup. Having a two-point measurement will require some additional setup in measurement configuration, which is explained in the next sections.
4. Connect and Define Topology #
We are now ready to establish a connection both to our local Probe and remote Probe. As before, press Connect to Qosium Probe. Scope will then attempt to contact the primary Probe in this computer, which in turn communicates with the secondary Probe in the remote computer.
Once connected, Scope automatically switches to the Topology Tab. For the primary Probe, the interface is the same as in the previous tutorial. For the secondary Probe, we simply select the interface which has IP address 192.168.1.236. Since our measurement path is exactly the path between these two computers, we can again set Placement to Measurement end-point for both Probes.
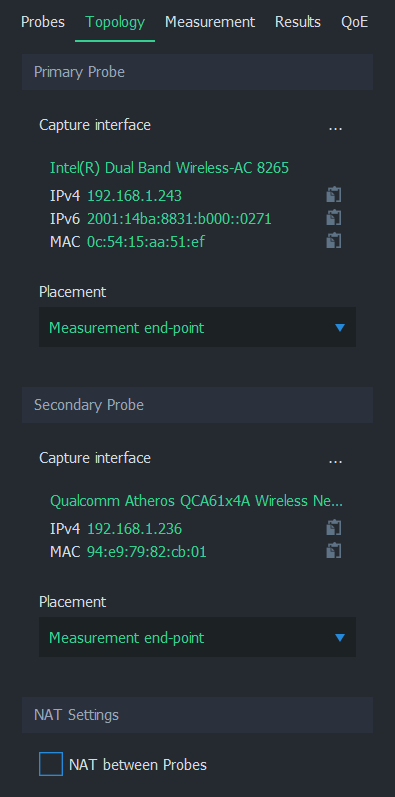
The new setting, NAT, is needed when there’s a Network Address Translation between these two Probes. This is not the case in our setup, so we leave it unchecked.
5. Define Packet Filter and Result Types #
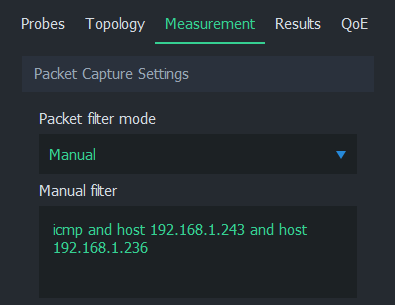
We could start the measurement already, but the current configuration would yield all traffic between the two computers. We only want the ping traffic to be displayed in results. Therefore, we need to define a manual packet filter.
Navigate to the Measurement Tab and change Packet filter mode to Manual filter. An additional text field appears, containing packet filter ip by default. Let’s change it to the filter we defined earlier:
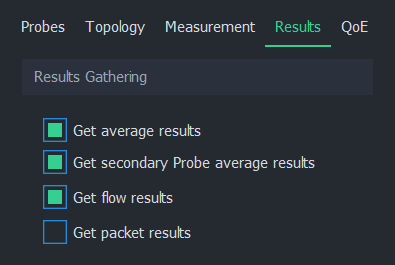
Next, open the Results Tab. Let’s leave both Get average results and Get secondary Probe average results on. Flow results are handy for inspecting the traffic flows traversing our measurement path, therefore we leave Get flow results on for verifying that the ping traffic we generated is visible in our measurement and that the packet filter is working properly.
6. Start Measurement #
Everything is now set, so let’s press Start Measurement button. The first thing we are going to do is to check the flows and verify that our ping traffic is being measured. Navigate to the Flows Tab next to the Dashboards tab. The flow table should display exactly one row:
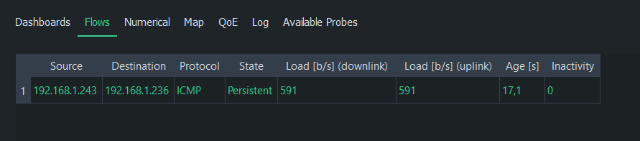
The information above indicates that one ICMP traffic flow is traversing our measurement path, which is exactly what we want to see at this point.
Now we are ready to see some QoS results. Return to the Dashboards tab and open a few charts. In Dashboard Settings panel, give this dashboard a name QoS Plots. Then, in the plots list, find category QoS statistics and expand it. Select the following plots:
- Connection break count
- Delay
- Jitter
- Lost packets, total
- Packet loss
- Successful packets, total
Close Dashboard Settings by using the gear icon on the right side of the window to allow more space for plots.
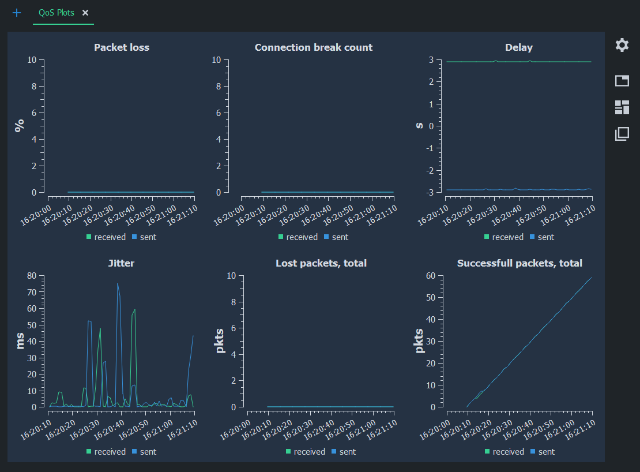
The plots already give lots of information about our test environment: The traffic has no lost packets, but there seems to be a large jitter variation. In the delay plot, we see an interesting result that delay seems to be negative to one direction and about similarly positive to the other. This is caused by clock synchronization error between the two measurement computers. See Time Synchronization for more details and how to solve it.
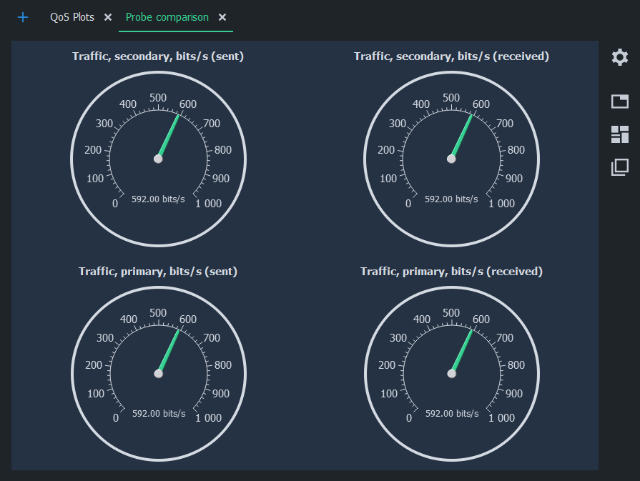
Out of curiosity, let’s check out how both Probes see the traffic. Our current dashboard is quite full, so let’s go ahead and create a new dashboard by clicking the blue plus icon next to our current dashboard tab. Rename this new tab to Probe comparison, and this time select a few meters instead of plots:
- Traffic statistics: primary
- Traffic, primary, bits/s (received)
- Traffic, primary, bits/s (sent)
- Traffic statistics: secondary
- Traffic, secondary, bits/s (received)
- Traffic, secondary, bits/s (sent)
Four meters will open, and we can see that most of the time they point to the same value. This is the expected behavior, as both Probes are registering sent and received ping messages. The meter needles can go temporarily out of sync due to packet losses and measurement timing.
7. Conclusion #
Whether QoS measurement results indicate “good” or “bad” quality is highly dependent on the requirements set by applications. We can safely conclude that our network conditions are sufficient for non-real-time applications, but this might not be the case, for example, for industrial real-time remote control connection. Determining the limits of optimal network conditions for a certain application is a matter of Quality of Experience, which is a whole another topic.
If you have already a test setup with some real traffic between two computers, it’s a good idea to try to measure that traffic now with the help of this tutorial. The process is otherwise the same, except the packet filter must be rewritten to match that traffic.
Suggested Pages
This tutorial will guide you on how to configure and perform a very simple measurement with Qosium Probe and Scope. Learning this basic tutorial will help you to understand the workflow of Qosium Scope.
Where to install measurement agents and measurement controllers, what can be measured, how to set the parameters, etc. That is what understanding measurement topology is all about. It is one of the key things regarding QoS measurements.
Packet filter is one of the essential concepts in passive measurement. An active measurement tool pushes a predetermined data stream into the network, so the traffic to be measured is always known. In passive measurement, on the other hand, existing traffic is measured, so filters are needed to define what part, in particular, of the total traffic is the interesting one to be taken into the measurement.