
First Measurement With Qosium
This tutorial will guide you on how to configure and perform a very simple measurement with Qosium Probe and Scope. Learning this basic tutorial will help you to understand the workflow of Qosium Scope.
Contents
1. Introduction #
In this tutorial, we have one Qosium Probe installed on the same computer where Scope is running, and we want to measure traffic coming from the Internet to this computer. The computer is connected to the Internet via a Wi-Fi connection. Our goal is to use the local Probe to measure how much traffic is received and sent between this computer and the Internet.
 Ethernet or any other type of connection is also OK, as long as there’s an interface Qosium can use to capture traffic.
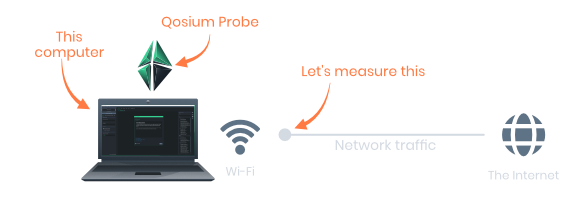
2. Preparation #
First, install and launch Probe and Scope in the computer where you are carrying out this exercise. Make sure that the computer is connected to the Internet.
 If Scope was already running, select File->New Measurement before starting this exercise
3. Setup Probes #
Navigate to the Probes Tab, which is on the left side in Scope window inside the Measurement Control panel.
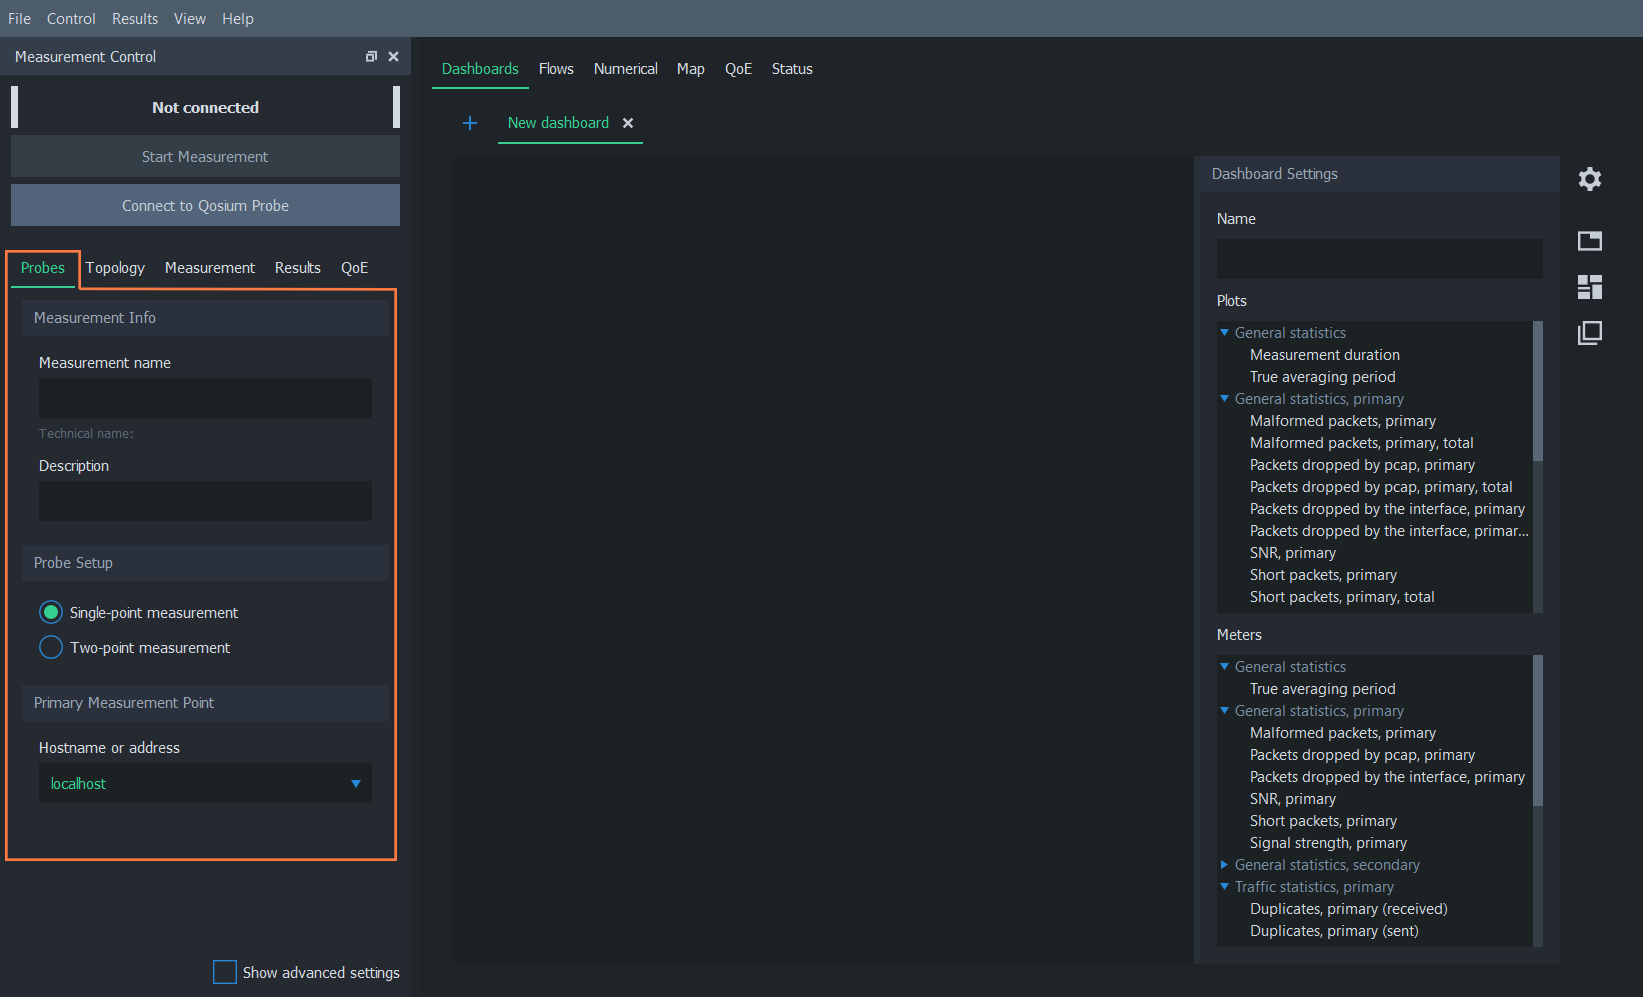
In the Measurement Info group, give your measurement a name and a brief description.
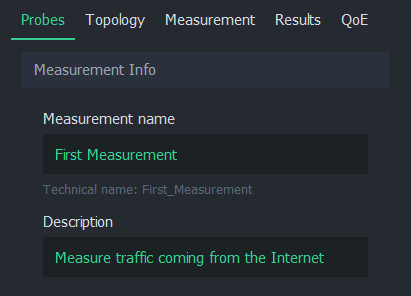
Next, define the measurement type. In a single-point measurement, only one Probe is used, yielding mainly traffic and flow statistics. In a two-point measurement, full QoS statistics can be measured in the network path between the selected Probes.
In this tutorial, we are only studying basic traffic statistics, so we leave this option to Single-point measurement.
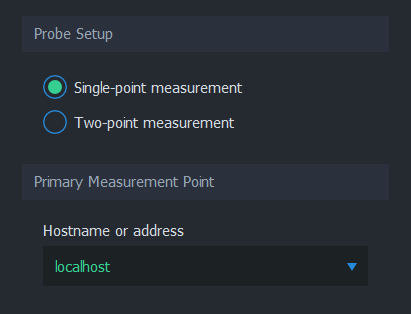
The location where the selected Probe is installed is called the Primary Measurement Point. The Hostname or address of this location can be given as a hostname or as a plain IP address, for example node.domain.com or 192.168.1.3.
In our case, the Probe is running on the same PC as Scope, therefore we can simply write either localhost or 127.0.0.1.
4. Connect and Define Topology #
We are now ready to establish a connection to our primary measurement point by pressing Connect to Qosium Probe. Scope will then attempt to contact the Probe in this same computer.
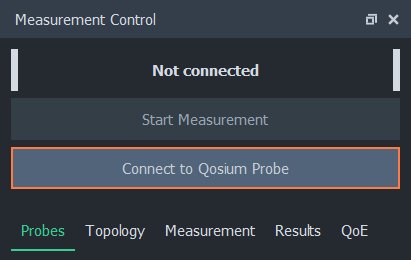
If this results in an error, it means that Scope is unable to establish connection to the Probe. In this case, check that the Probe is running on the background and try again.
If a green Connected text appears, as depicted below, Scope was able to connect to the Probe successfully. Scope automatically switched us to the Topology Tab, where a few things must be taken care of before starting the measurement.
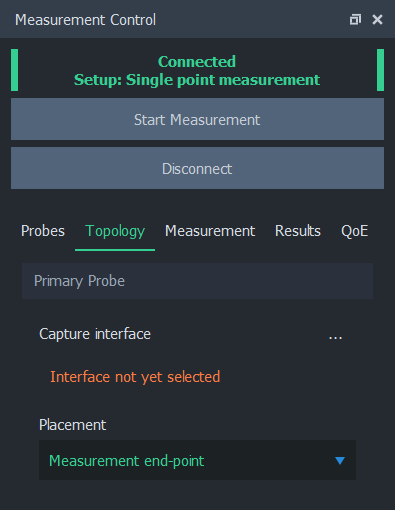
The Probe needs to know which network interface it is supposed to listen to during measurement. Select the interface by pressing … on the right side of Capture interface. A dialog opens, which lists the interfaces of this computer.
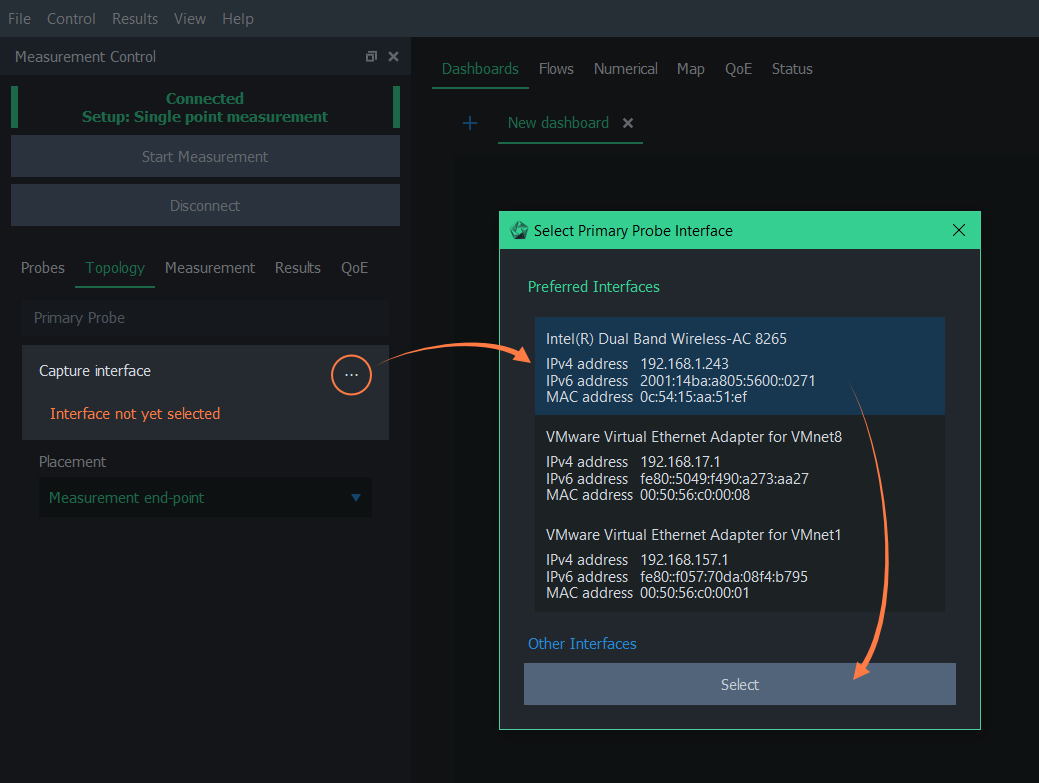
We’ll select the network card which is connected to the Internet from the dropdown list by double-clicking, or clicking it once and then pressing Select. In this computer, that interface would be Intel(R) Dual Band Wireless-AC 8265.
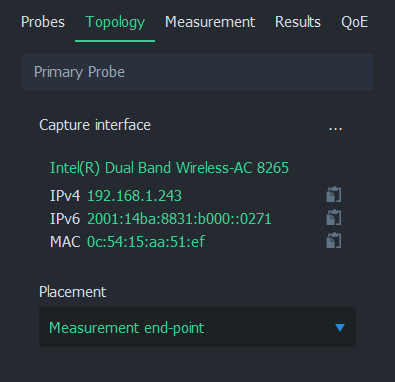
The selected interface is now displayed in the Primary Probe group.
Next, we need to tell Qosium something about the network topology in order to help it determine the direction of the traffic. In a single-point measurement, we only need to inform Scope the placement of the Probe in relation to the measurement path. The options are:
- Measurement end-point - Probe is located in either one of the end-points of the traffic we want to measure
- Within measured path - Probe is located somewhere in the path of the traffic we want to measure
- Off-path (mirrored traffic) - Probe is located outside the path of the traffic we want to measure
Luckily, our case is straightforward: the Probe is located in one of the end-points, so no further parameterization is needed here.
5. Configure Measurement #
All essential work is already done, and we could start the measurement already. However, let’s head to the Results Tab and configure Scope to save the measurement results to a file in real-time.
Under the Results tab we can select the result types we want to gather, and whether they are written to local files. For this scenario, we only need the average results, so let’s uncheck Get flow results. Let’s select Write average results to file. Now, average results will be saved to a file in real-time during measurement.
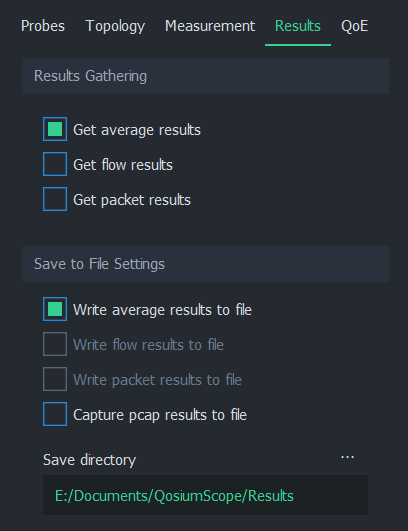
Also, mind the directory where the measurement results are saved. With the given settings, our average results will be written (in Windows) to E:\Documents\QosiumScope\Results\averages_First_Measurement.txt.
6. Start Measurement #
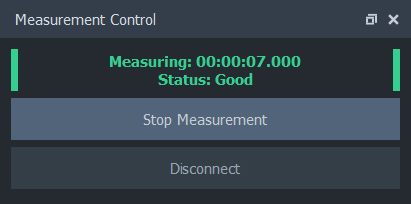
Everything is now set, so let’s press Start Measurement button. The measurement starts running, as indicated by the status text:
Let’s leave the measurement running and check out some measurement results. By default, Scope has Dashboards tab open. On the right side is the Dashboard Settings panel. If the panel is not visible, press the gear icon.
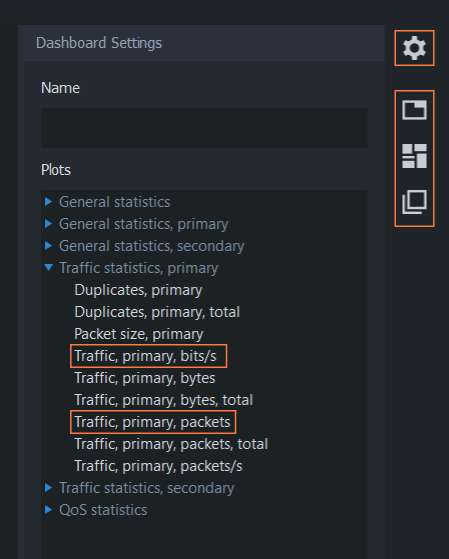
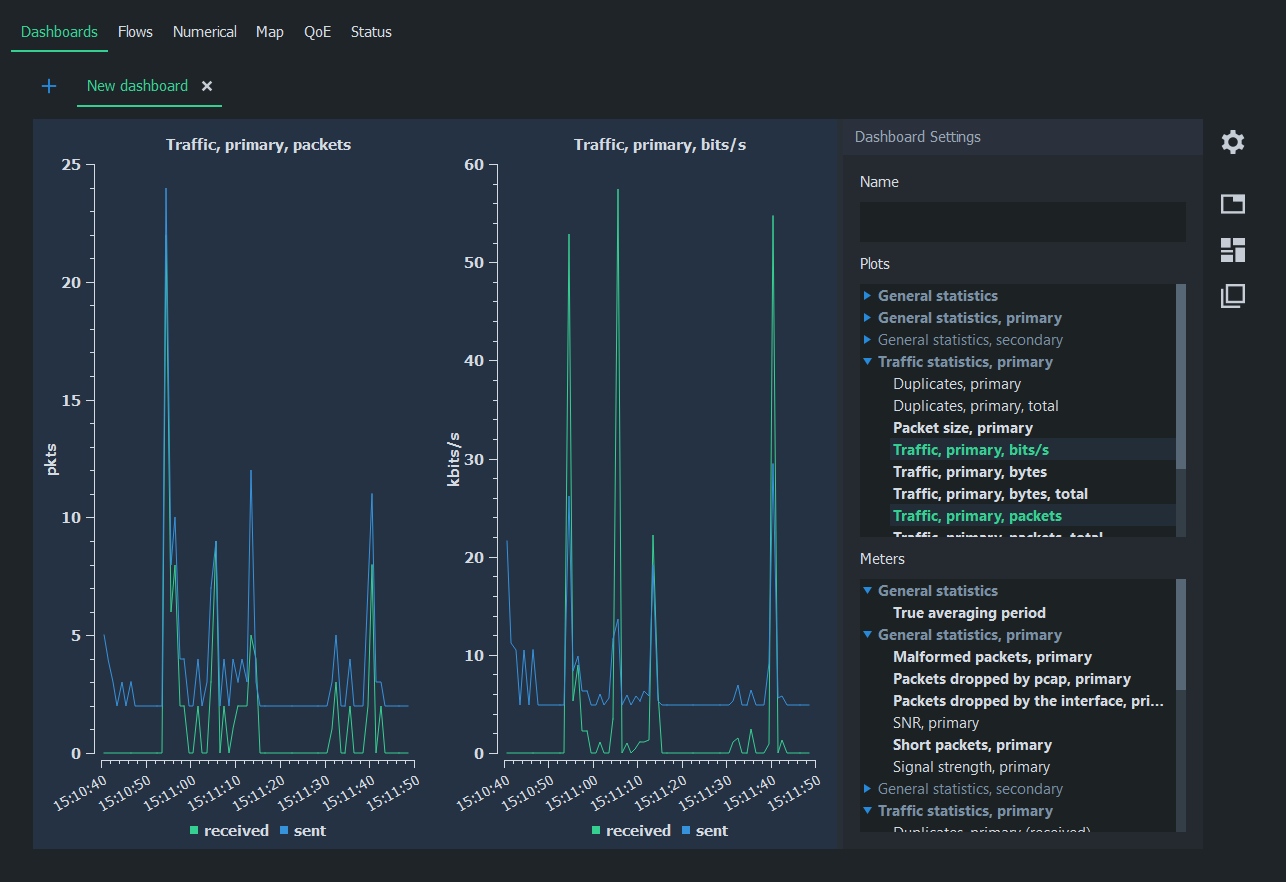
From the Plots list, select two result types: Traffic, primary, bits/s and Traffic, primary, packets. Two plots will appear immediately, displaying the traffic load in terms of bits and packets moving between this computer and the Internet. You can reorder and rearrange plots by using the buttons below the gear icon.
And that’s it! Since we are writing the results in a file, they can be read and analyzed later in detail. When done, press Stop Measurement.
If you forgot to enable the real-time result writing, you can save the results also after the measurement via the menu bar: Results -> Save Average Results…7. Conclusion #
While we barely scratched the surface of Scope functionality, each measurement has the same workflow:
- Setup Probes
- Setup topology
- Set parameters
- Start measurement
- Observe results
In order to learn how to perform a QoS measurement using two Probes, head to the next tutorial.