Using Qosium is typically either manual measuring or automatic monitoring. Measuring can be, for example, field tests for wireless network performance, troubleshooting network problems, or benchmarking a device or a service during R&D operations.
Measurement Control
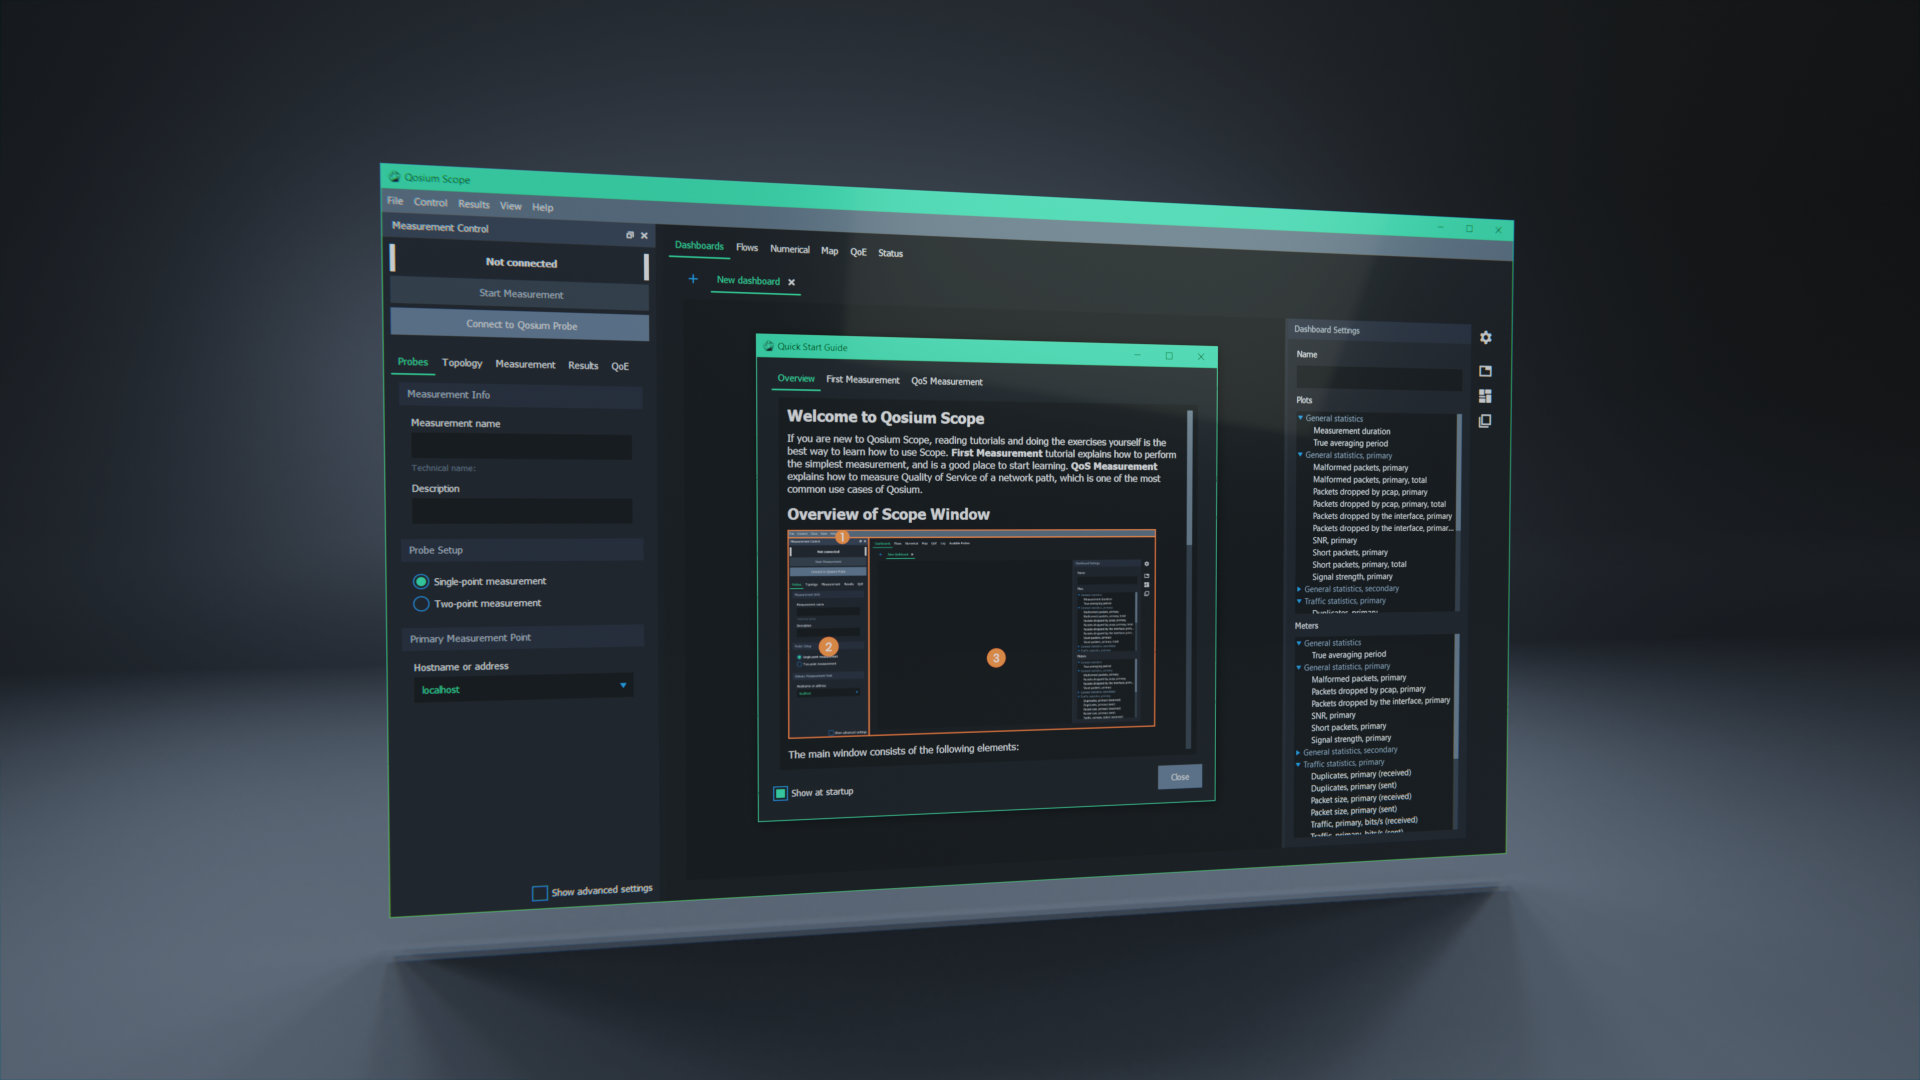
The measurements are managed by using Qosium Scope. It is a comprehensive analyzer software for manual measurements. With Scope, all features of Qosium measurements are at your fingertips.
With Qosium Scope, you parameterize and run measurements, collect results, and visualize them in many different ways. Unlike many other professional tools, its use is intuitive. It’s only a few settings you need to touch in most cases to start a measurement. Scope saves all user-interface-related settings, including even window sizes, along with the parameters, so you can resume measurements exactly where you left off. Scope is also useful after a measurement campaign: you can input previously measured results and leverage its comprehensive visualization features for analysis.
Result Analysis
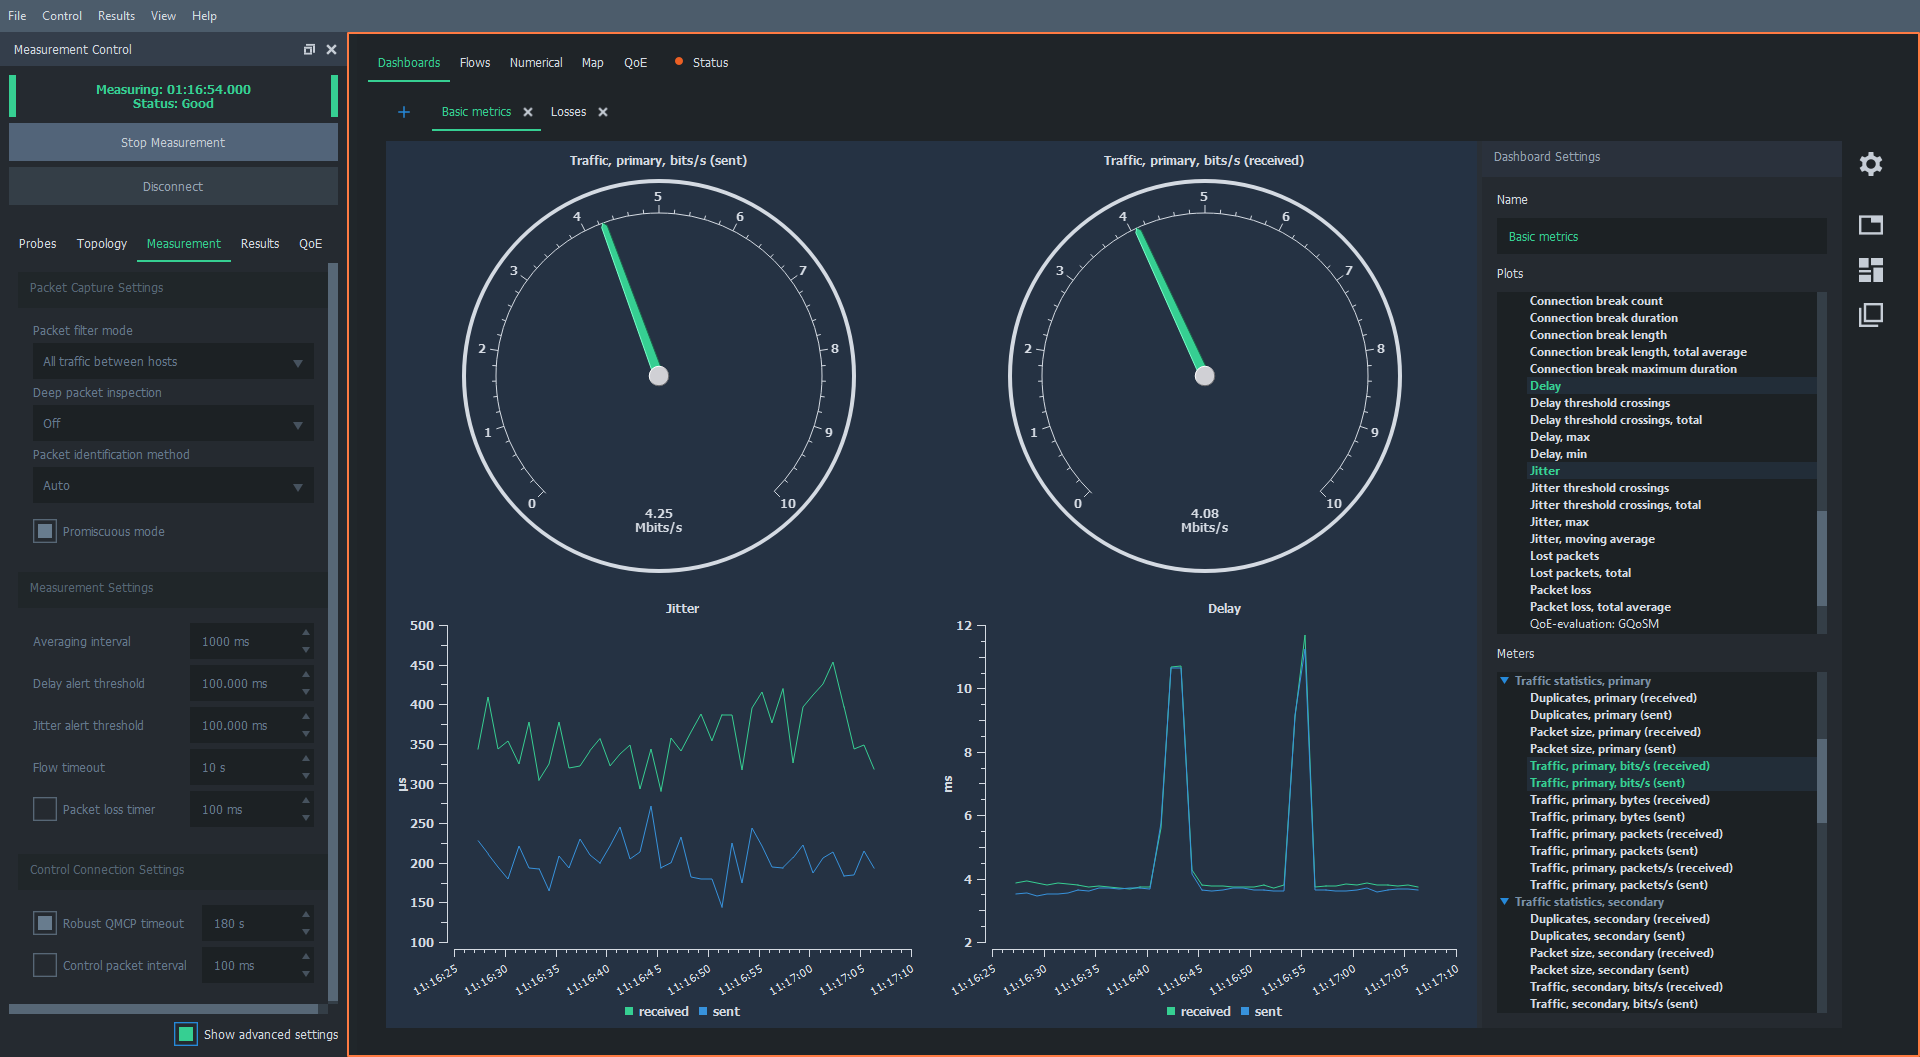
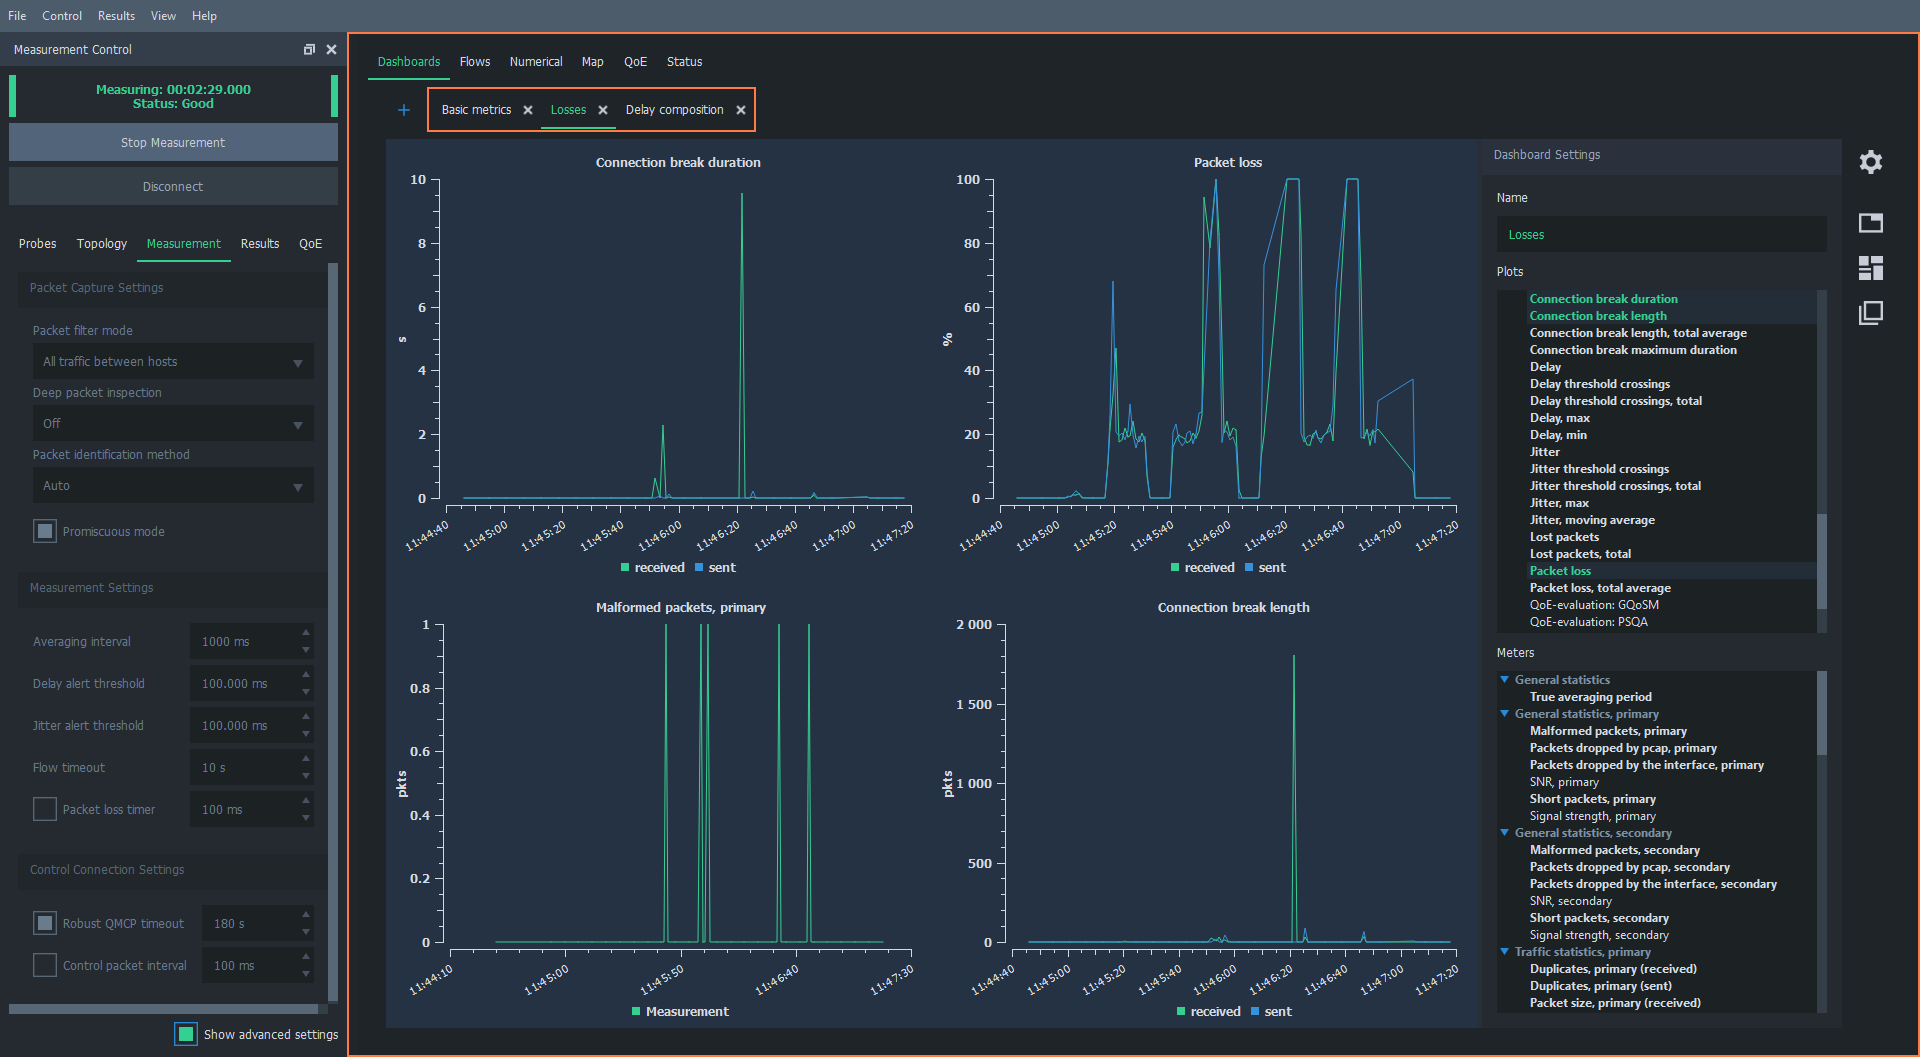
Measurement results are typically analyzed in Qosium Scope in real time during the measurement at a high level, with more detailed analysis conducted afterward. Results can be visualized in various ways: as meters, graphs, heatmaps, bars, and precise numerical values. You can review the data as averages over your desired sample range. If something interesting is found, you can drill down directly from the average results to packet-level data for the point of interest. Since all Qosium software components use the same output file format, Scope can also analyze results from measurements performed with other controllers (Qosium Scope Lite and Qosium Scopemon), as well as data downloaded from Qosium Storage.
Graphs and Meters
When examining results as graphs, you can see how metrics have evolved during the measurement. Meters, on the other hand, are the most illustrative for showing the current status. Metrics such as delay, jitter, traffic load, and packet loss are always measured and visualized separately for sent and received traffic. You can easily select which metrics you want to visualize.
Changing between different visualization types and creating your dashboard views is easy. You can select the measures for visualization freely and name the dashboards as you wish.
Heatmap
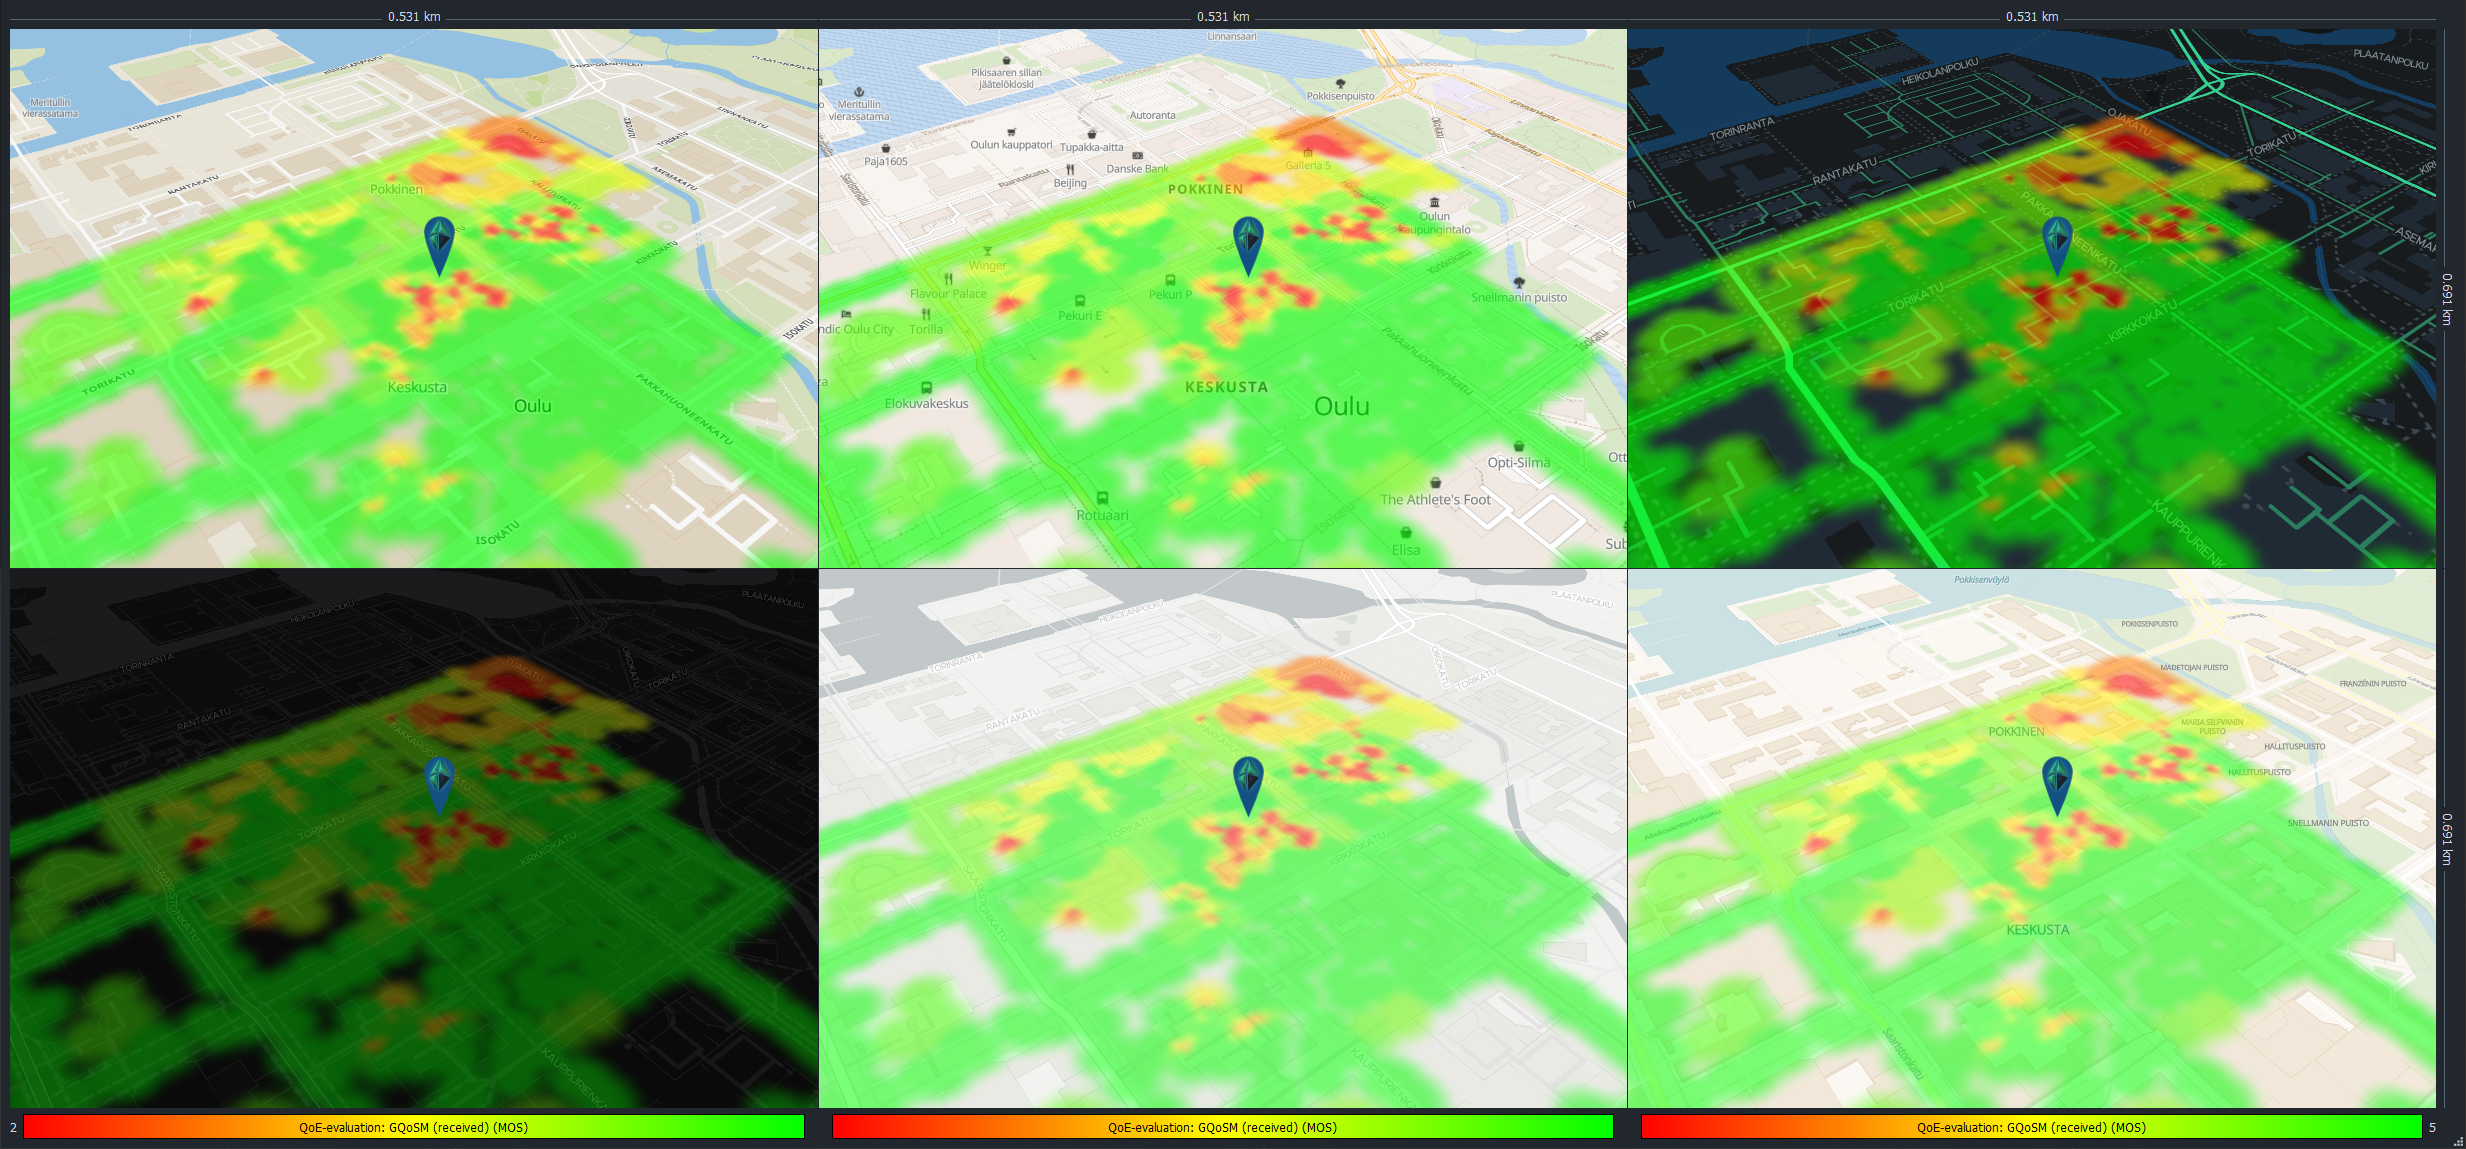
When measurements include geolocation data, Qosium Scope offers the ability to visualize any of the numerous statistics on a map. The QoS heatmap view is the crown jewel of visualization, making it an excellent tool, especially for drive tests. The color thresholds for poor and good performance are adjustable by the user, so the heatmap can be tailored to the specific needs of the measured application, for example, how much delay it can tolerate.
You can overlay images, such as building floor plans, onto the map. The map is also interactive, allowing you to manually input location data during a measurement with just a mouse click. This feature is particularly useful for indoor measurements, where obtaining precise geolocation data automatically is often challenging. The heatmap’s rendering style can be customized in various ways, and multiple map styles are available, ranging from basic to the distinctive Kaitotek style. Currently, there are six different styles to choose from, ensuring you’ll find one suited to your intended use.
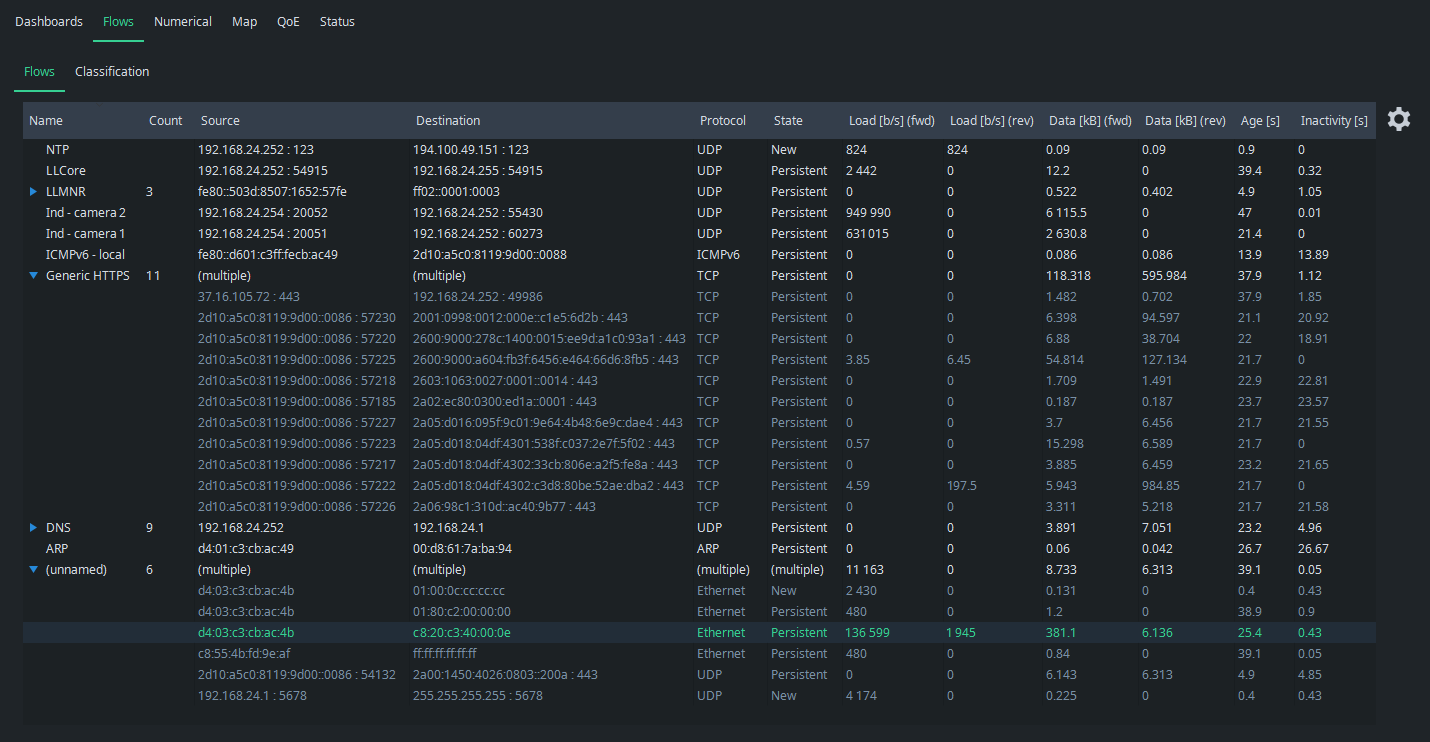
Clarified Traffic Flows
It’s not always necessary to delve into QoS metrics; instead, it may sometimes be more interesting to break down the traffic into its content: what types of traffic flows make up the overall traffic. The Qosium flow analyzer addresses this need. You can see, for example:
Where traffic flows originate and terminate,
Which protocols are in use,
What kind of load the flows generate, and
How long they last.
The flow analyzer is handy also during QoS measurement, as it quickly shows which traffic flows are included in the measurement.
One of the key features is a classification of traffic flows, which brings systematic order to what might initially appear as a chaotic list. You can name flows based on multiple criteria, and flows meeting the same criteria are conveniently grouped under a single label. This allows you to quickly determine, for example, whether the traffic profile of a production network matches expectations.
The traffic flow analyzer is like a separate tool within a tool. It’s not limited to real-time analysis, but you can also go back in time to see what happened to traffic flows at any point during the measurement. This eliminates the need for resource-intensive packet captures for traffic analysis. Packet captures can be limited to rare situations where there’s a genuine need to analyze the contents of individual data packets.
Flow monitoring also has a strong link to cybersecurity: Are there any suspicious traffic flows visible? Once all known flows are named, any new or unknown traffic is immediately revealed in the flow analysis.
The document section talks more about Qosium Scope.
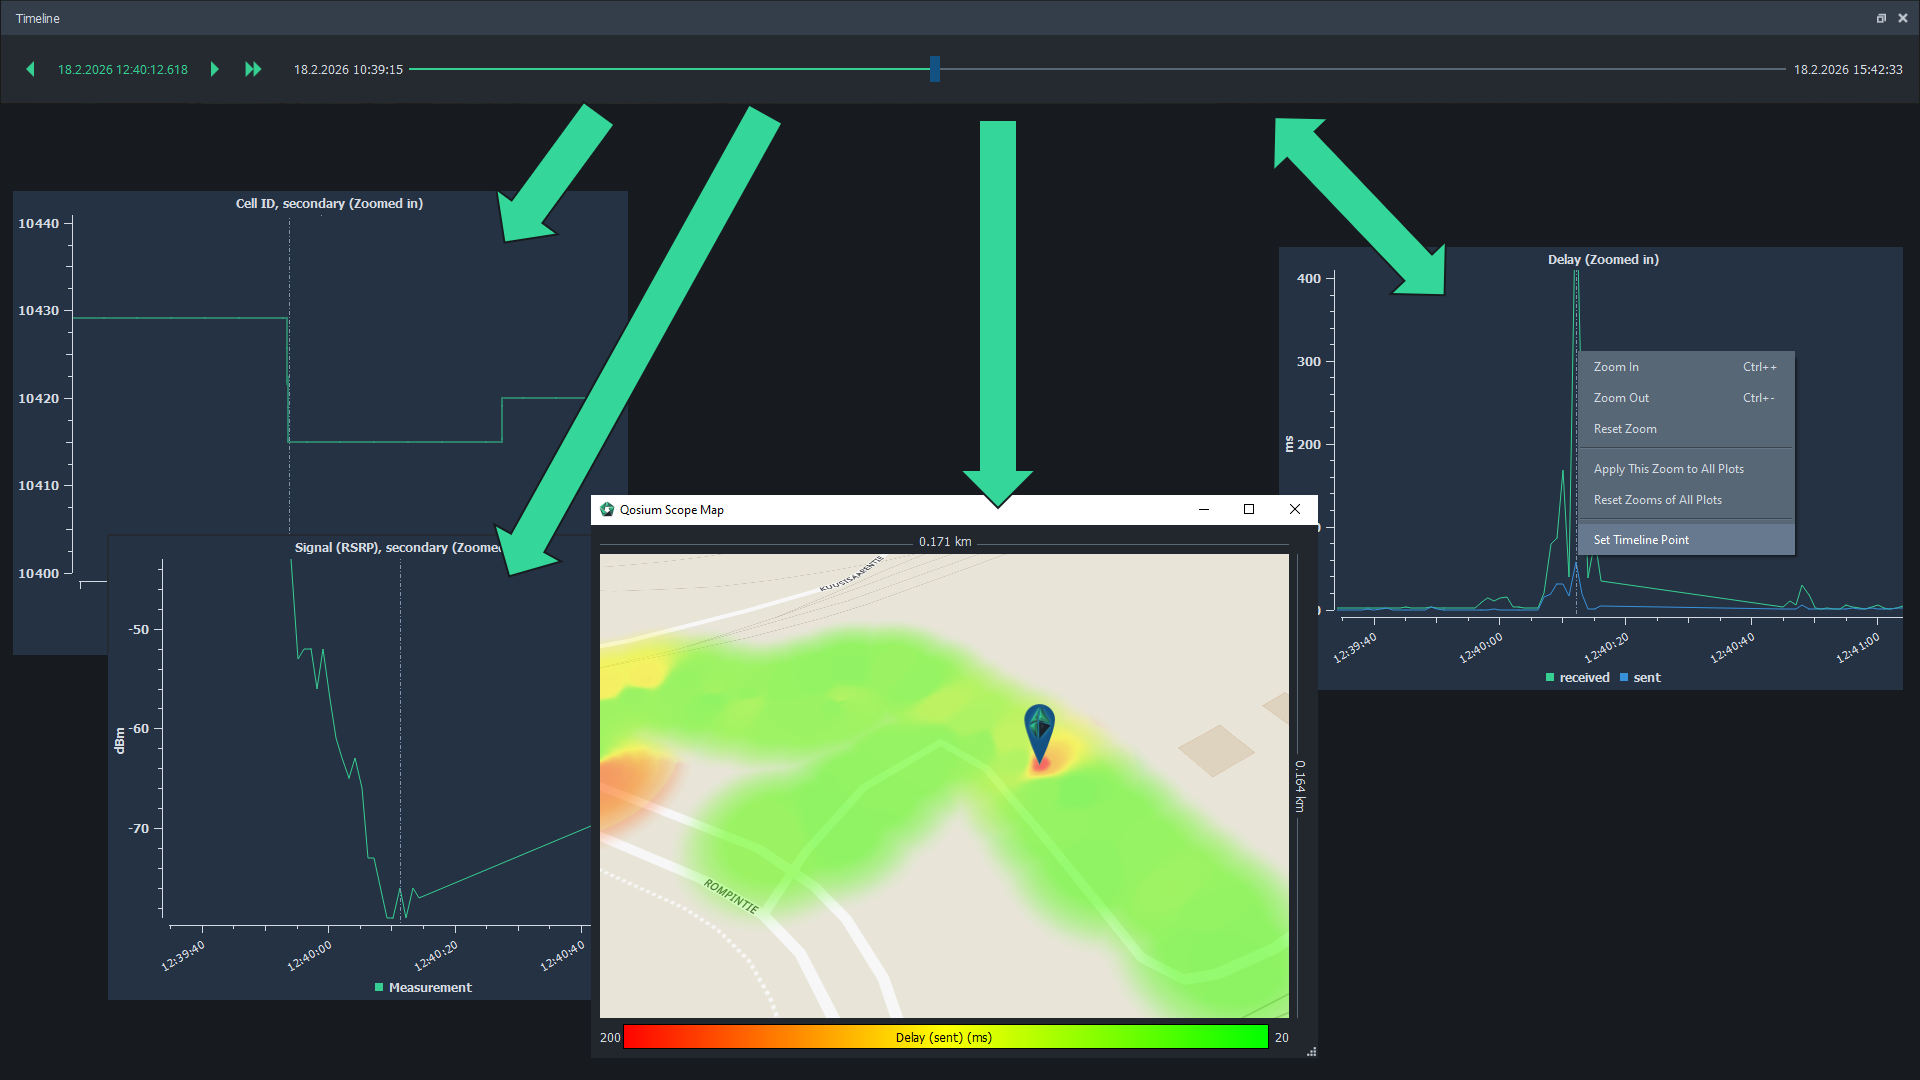
Align with Timeline
Qosium Scope’s timeline is a powerful tool: you can browse history and align interesting events between all the views. When you set the timeline to a specific point in one graph, it aligns to the same moment in every graph. This synchronization extends to the map, numerical, and flow results as well. For example, you can check what the signal strength was at the exact moment a latency spike occurred and which cell the device was connected to. The map shows the precise location where this happened.
The timeline also gives you access to the flow analyzer’s historical data. For example, if you notice a significant data traffic spike, you can use the timeline to jump to the flow results and see which traffic flows caused the spike.
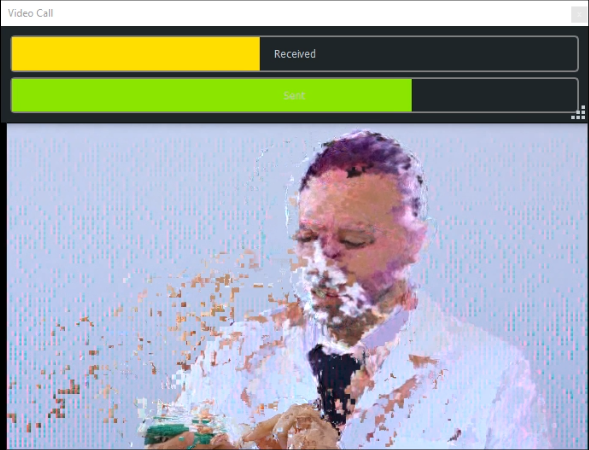
Quality Bars for Demos
In addition to precise measurements, Qosium Scope is widely used for technical demonstrations. For this purpose, Scope’s service experience bars are exceptionally well-suited. These bars can be overlaid transparently next to or even on top of the application being analyzed. For example, using two screens, you can demonstrate how a new communication technology delivers excellent quality, while an older technology visibly and measurably struggles under the same conditions.
Qosium can also take packet captures from the traffic being measured. This is an optional feature, which can be left out entirely from a build if desired, e.g., for cybersecurity purposes. A Pcap file is generated, which can be taken, for example, to Wireshark for accurate protocol analysis. Packet capture is taken at layer-2, ensuring that MAC layer protocol headers are also included.
Toolbox
The selection of Qosium-components is based on the need. When performing manual measurements, you typically need only Qosium Scope in addition to the always-present measurement agents, Qosium Probes. In limited environments, you can use Qosium Scope Lite.
In more comprehensive measurement setups, it might be helpful to use a separate results system like Qosium Storage, but it is typically only needed when executing automatic monitoring.
As Qosium is a passive measurement system, the measurement target often is real service/application traffic. Sometimes, however, it might be necessary to use synthetic traffic streams in measurement campaigns. In these cases, Qosium can be used semi-actively: the traffic to be measured is actively generated with an external traffic generator, while Qosium is used passively to accurately measure its QoS over the interesting network path.
You can measure in all networks without the need for having an Internet connection.
Measurement Scenarios
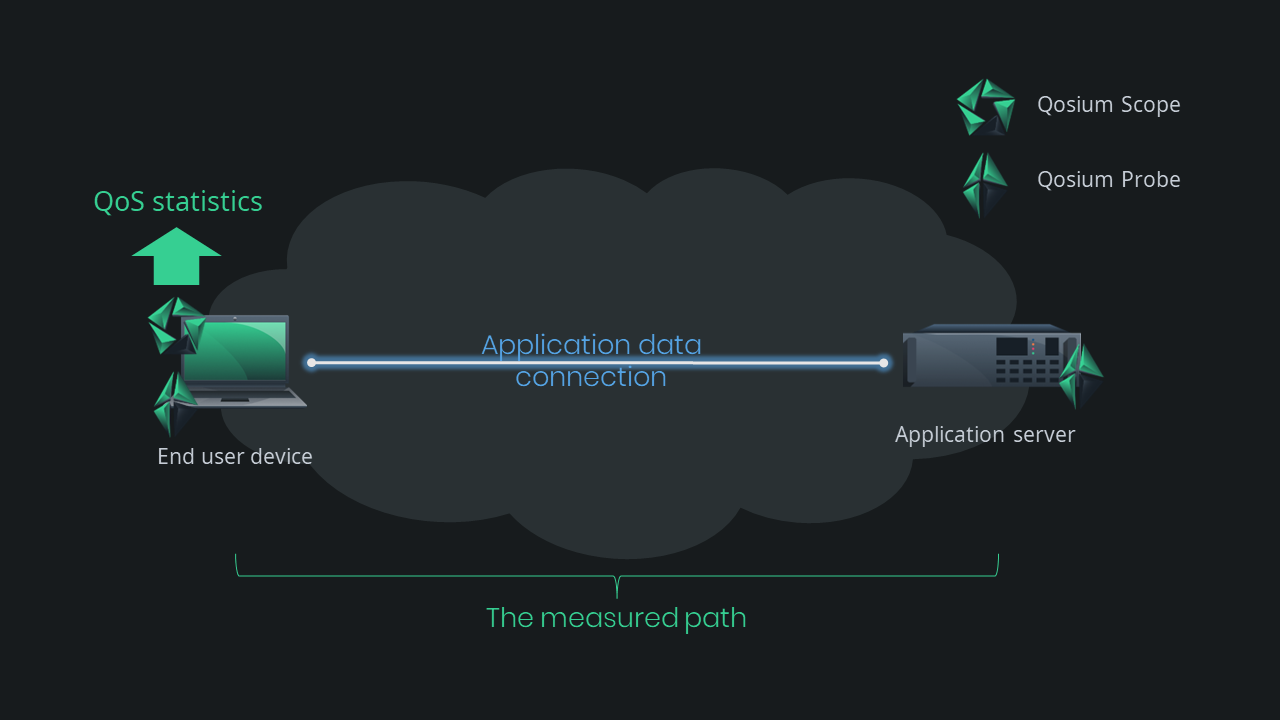
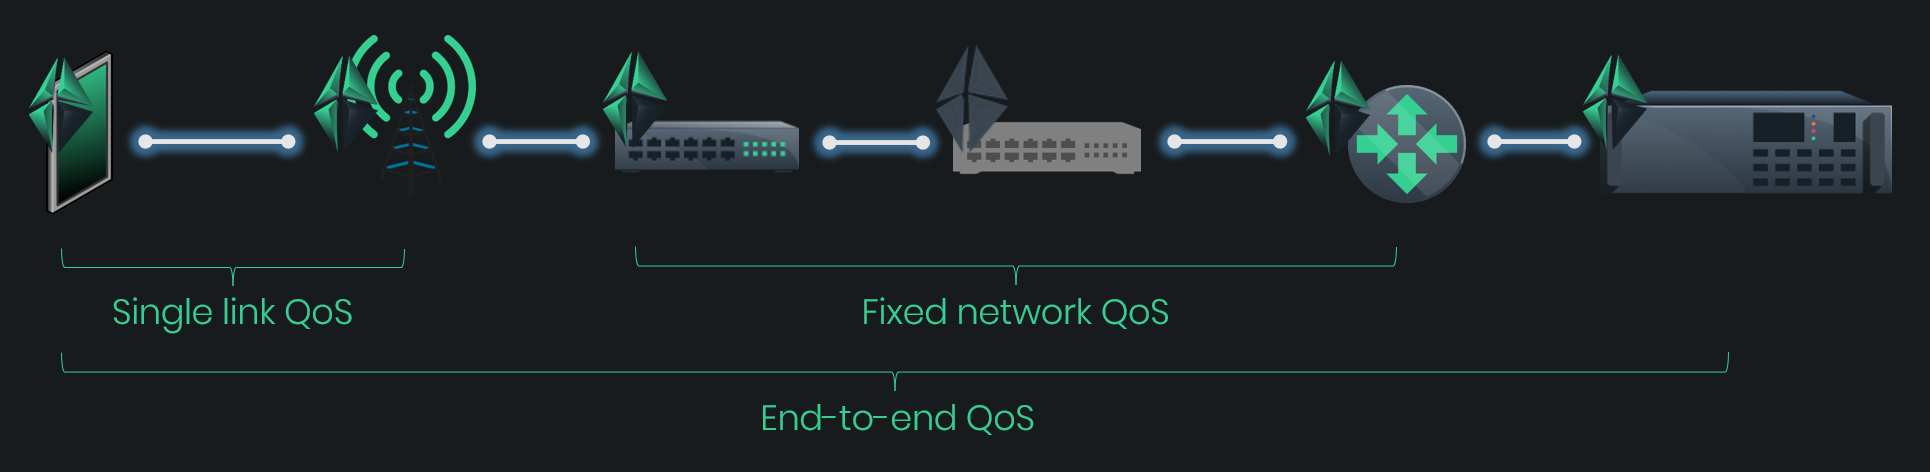
The placement of Qosium Probes defines the basis for the measurement. QoS measurement is targeted in the network path between the Probes. You can also measure in a single point, but the available results will be considerably limited.
The example below presents one of the most straightforward measurement scenarios. Qosium Probes are installed in the communicating end devices, so the setup is an end-to-end measurement. This setup yields accurate QoS statistics on how the measured application experiences the whole network path. The measured traffic can range from a single flow to all the traffic between the measurement points.
Qosium Probe takes care of almost all of the measurement-related calculations. As a passive agent, Qosium Probe needs to sit on nodes from which measurement results are wanted to be collected, i.e., the measurement points. Qosium Probe is typically being run as a system service hidden in the background. The visible part of the measurement is Qosium Scope, which you use to control the measurement. It can lie on the same device as Qosium Probe or elsewhere.
The measurement setup can also be more complex. Instead of a single measurement, there can be multiple ongoing measurements at different network parts. In addition, the setup does not need to be end-to-end, but the measurement can be targeted to a specific part of the network, like, for instance, the wireless access part. A single Probe can handle multiple simultaneous measurements, so you only need one Probe per device.
Qosium needs no support from the measured traffic: it can be any IPv4 or IPv6-based or even pure Ethernet traffic. No requirements are set for the network either. Instead, the links between the network nodes can be of any wired or wireless technology.
Qosium Probe can be installed on almost all desktop and server machines, lightweight end devices, and many embedded devices. We continuously extend Qosium to new platforms and operating systems according to demand.
The document section talks more about Qosium Probe.