
User Interface
This section guides you through how to interact with Qosium Storage.
Contents
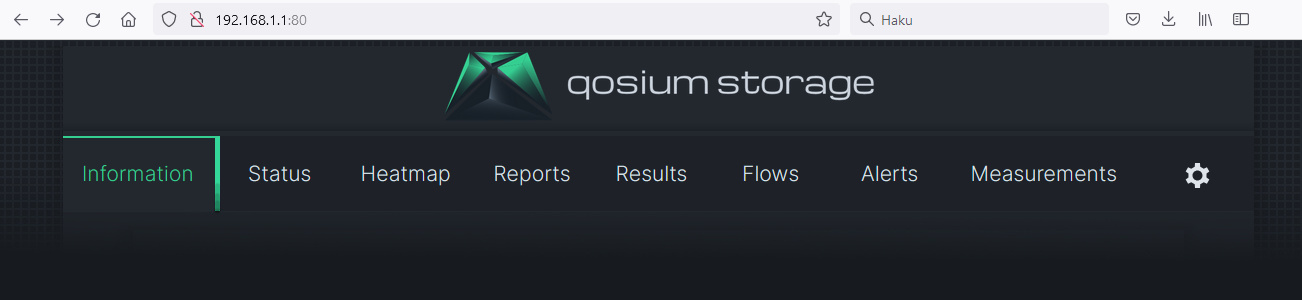
1. Accessing #
Qosium Storage is used via a web browser. Thus, open your browser and type the address and port where your Storage’s web server is bound. If you don’t know Qosium Storage’s port, check the parameters.
2. Tabs #
2.1. Overview #
When you enter Qosium Storage, you will land on the main page in the Information tab. There are typically three other tabs also visible.
Sometimes the Heatmap tab might be missing. If so, it has just been disabled. Via parameters, you can activate it. The next sections discuss the content of each tab.
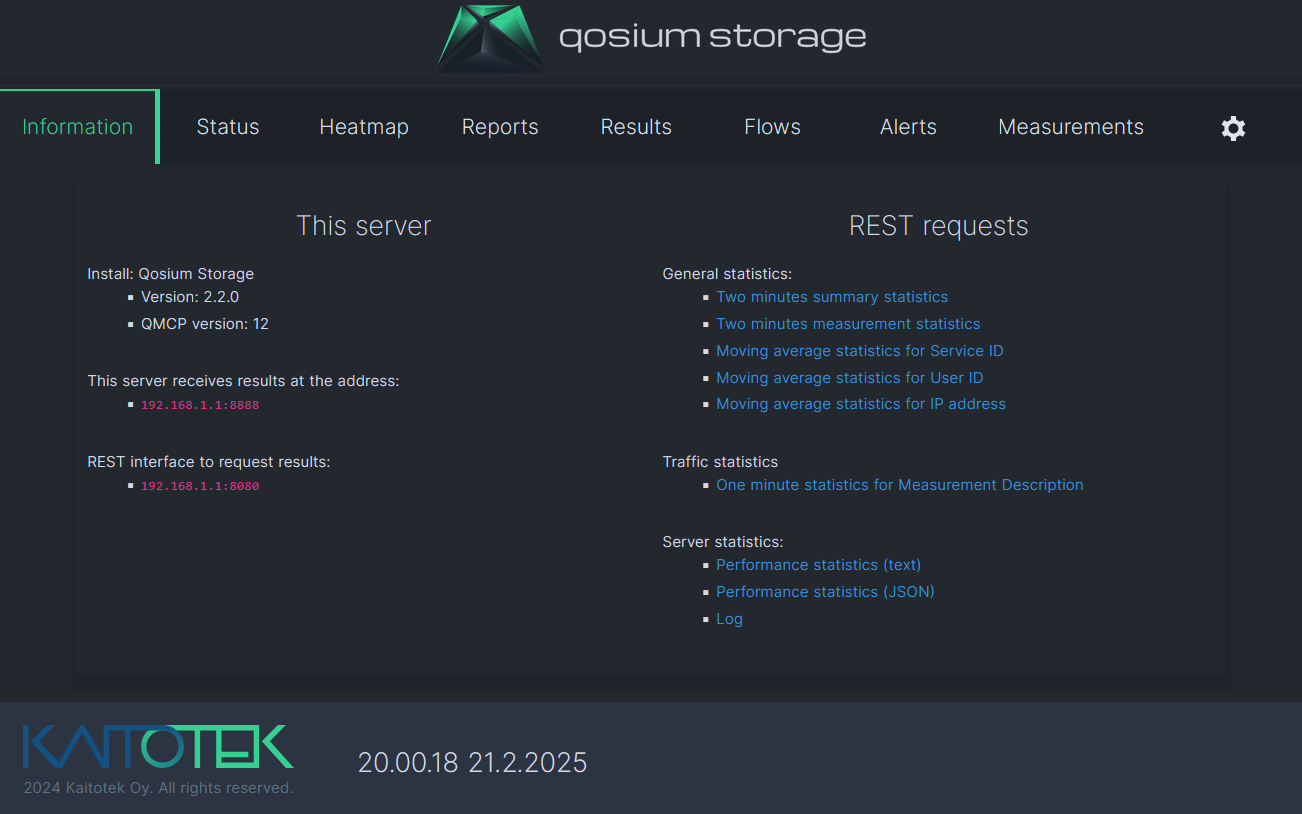
2.2. Information #
Information tab is all about what the name says: information regarding the current installation of Qosium Storage. The information is split into four sections.
This server section tells the installation name, version, and relevant server ports. It also tells the QMCP main version, which is of importance since different main versions are typically non-interoperable. For instance, if you are running an outdated Qosium version of QMCP 10, you cannot send results to Qosium Storage with QMCP 11.
REST requests section shows some general REST requests available, and they can also be tested through the links. These are, however, not all the available REST calls, and more REST calls can be easily provided. In case you are interested, contact Kaitotek support to inquire about the REST API documentation of Qosium Storage.
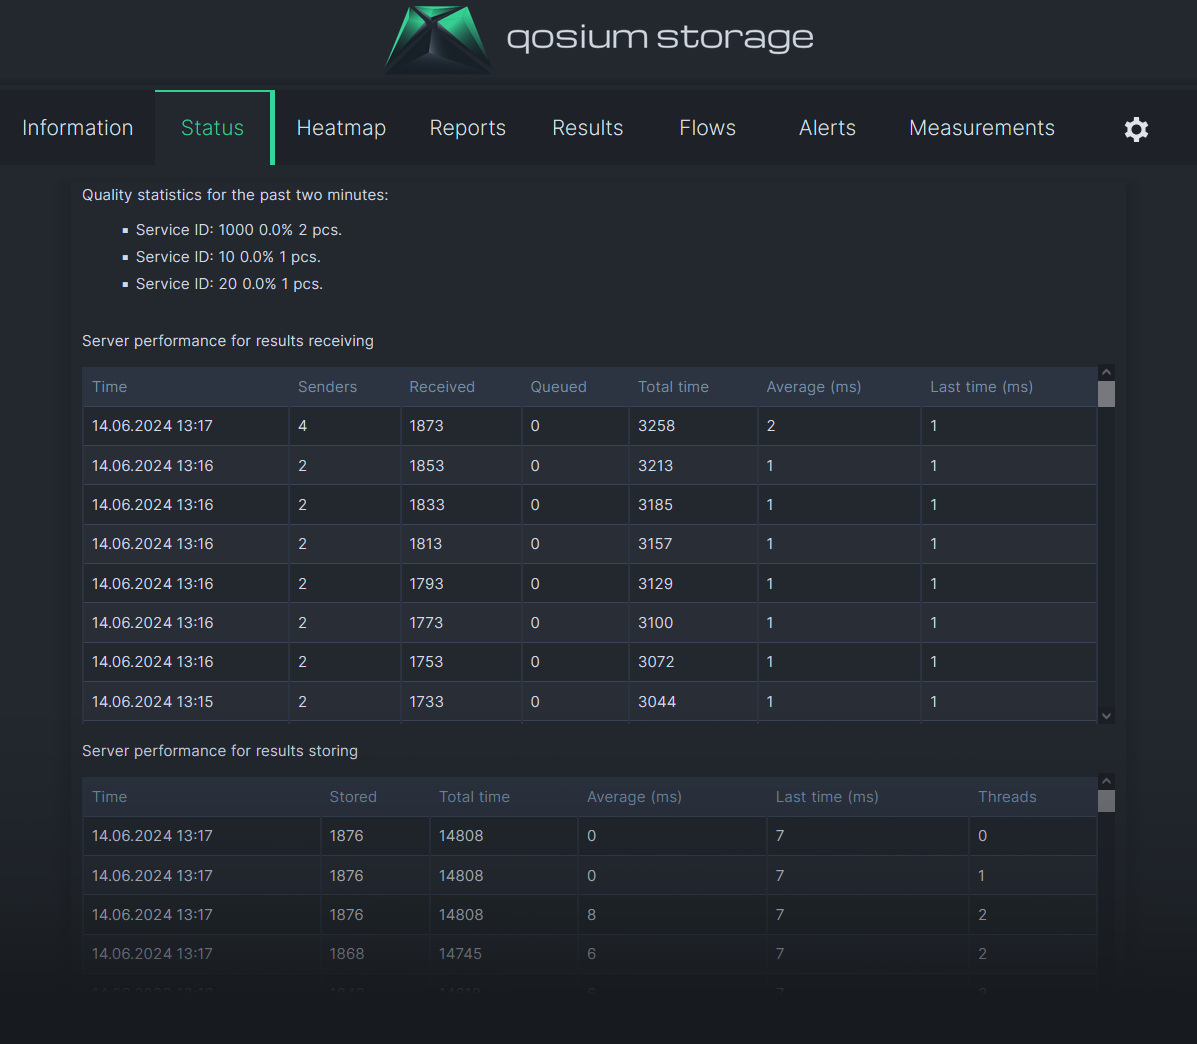
2.3. Status #
Status tab is the place to get up-to-date information on the health of Qosium Storage itself. It is divided into three sections.
The first section shows ongoing measurements within the last two minutes period per Qosium’s Service ID. As seen in the figure below, there are four ongoing measurements.
The second section shows the results reception performance. The observation interval is parameterized using this parameter. The columns are as follows:
- Time – When the performance calculation was made.
- Senders – The number of results senders (= measurements) that were ongoing
- Received – The total number of average results received
- Queued – The number of average results waiting to be stored
- Regarding Qosium Storage’s health, this is an important performance metric, as it indicates can Storage keep up with the pace the results are being received.
- If the queue starts to pile up, it might be an indication that there are not enough computational resources for Qosium Storage to serve the current monitoring scenario.
- Total time – The total time spent for receiving the measurement results
- Unit: ms
- Average (ms) – The time it took, on average, to receive a single result
- This is yet another important performance metric.
- A well-performing system should handle the reception procedures in one millisecond, and definitely < 10 ms.
- Unit/resolution: ms
- Last time (ms) – The time it took to receive the last result
- Comparing this with the previous performance metric gives an idea of how much there is deviation in the reception procedure durations between samples.
- If the deviation is high, it is a potential indication of problems.
- Unit/resolution: ms
The third section is about results storing performance. Most of the columns are analogous to those in the second section but now considering storing instead of receiving. Thus, these performance metrics tell how the database storing processes are functioning.
The only column having no corresponding one in the second section is Threads. It tells how many computational threads are currently active connecting and writing to the database. In heavy-load situations, there can be several tens of threads. This is mostly informative and typically not an indication of performance problems. Instead, the storing times (Average (ms) and Last time (ms)) are mostly the ones to follow.
2.4. Heatmap #
Heatmap is handled in its own article because it is a larger entity.
2.5. Reports #
Reports tab gives you an overall QoS view of the monitored system. You can make daily and weekly reports. Focus is especially on delay, being one of the most important metrics in critical systems.
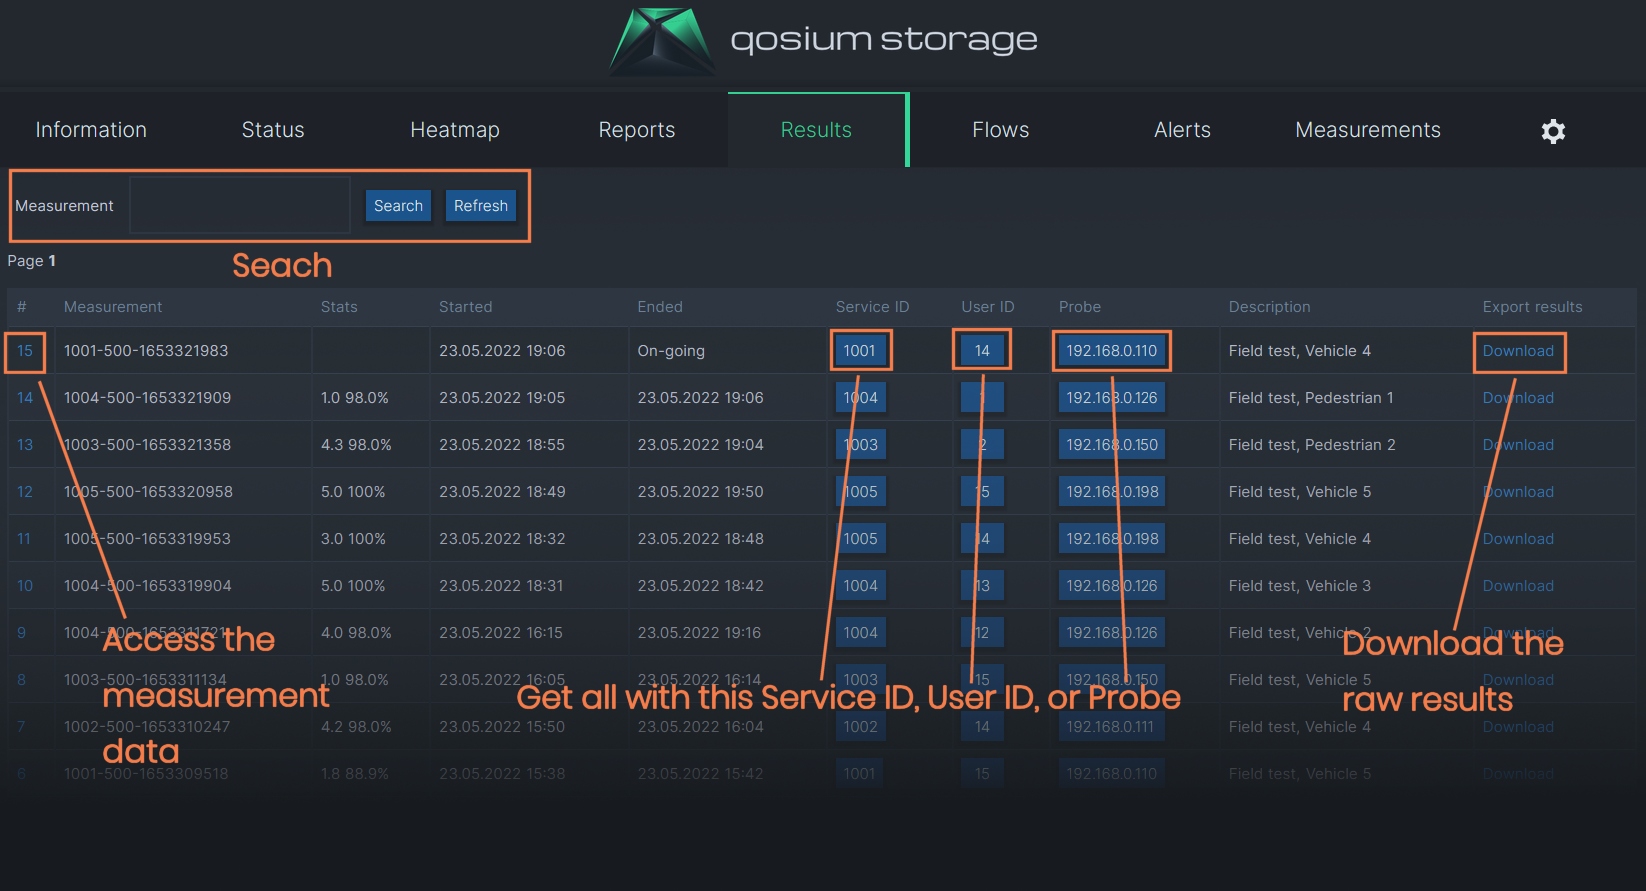
2.6. Results #
Results tab shows a list of all the stored measurement results as a table, including some key elements of measurement identification.
The first column is the Storage’s running number of the measurement. By clicking that, you can access the measurement data shown as a large table, potentially of several pages, depending on the length of the measurement. While this might be useful for quick evaluation, detailed analysis often requires downloading the measurement data, and the last column of the Measurements tab can do that.
Results tab also shows a quick glance at the overall quality in the Stats column. Starting and ending times of the measurement are shown in columns Started and Ended, respectively. If the Ended column shows On-going, the measurement has not yet finished. Sometimes it can happen that the network connection between Qosium Storage and the Qosium Probes carrying out the measurement has gone down. As a result, no measurement end notification arrives at Qosium Storage. In this case, Qosium Storage shows the measurement as ongoing for some time until, because no new results come, a judgment is made that the measurement must have ended.
Each measurement has a unique Qosium Storage identifier string in the second column. Service ID, User ID, and Probe (Primary one) are related to measurement identification, shown in the respective columns. Those can also be clicked for instant search. For example, by clicking Service ID 1001, performs a search listing all measurements carried out with Service ID 1001. You can execute custom text searches in the upper left corner. In addition to the different IDs, the Description field is also included in the search.
2.7. Flows #
Flows tab shows the flow results. The main difference to the Qosium Scope’s equivalent is that this is a collection of all the flows from all the measurement points, generating flow results instead of results from a single measurement. You can observe the overall view of all the flow results sources or drill into the details of a single measurement point.
2.8. Alerts #
Alerts tab lists the occurred alerts, while parameterization takes place in the Settings tab. Once a particular alert is triggered for the first time, it becomes active and stays that way until cleared by the user. When active, threshold crossings of the same criteria during the same measurement are calculated as occurrences in the same alert. However, once an alert is cleared, a new occurrence is interpreted as a new alert. An alert contains the following basic information:
- State (Active/Closed)
- Code – A (locally) unique code identifying an alert.
- Time, detected – Determines the time when the alert occurred for the first time.
- Time, latest – Stores the time when the latest occurrence of this alert was recorded.
- Time, closed – The time, when the alert was closed by the user (when closed)
- Occurrences – The count how many times this particular alert has been triggered.
- Measurement – The Qosium Storages (locally) unique code for the measurement that caused the alert.
- IDs – Service ID (primary and secondary Probe) and User ID (the controller)
- Category – Tells is the alert QoS/QoE based or something else
- Type – Identifies the type inside an alert category, e.g., delay-based.
- Threshold value – Informs what was the set threshold value for the followed property
Additionally, several measured performance values are included, providing insight into the conditions under which the alert occurred:
- Minimum QoE
- Maximum delay
- Maximum jitter
- Maximum packet loss
- Maximum connection break duration
- Lowest signal strength (when applicable)
- Lowest SINR (when applicable)
2.9. Measurements #
Qosium Storage is not only about storing the measurement results, but it can also be used to control the measurements in the network. That is carried out in Measurements tab. Control is mostly about just setting parameters. You can set them directly, or, sometimes, it might be handy to test the measurements with Qosium Scope first, and then use it to generate the parameterization file to be fed to Qosium Storage.
 Controlling measurements from Qosium Storage is the natural choice in star topologies, where the central measurement point lies near Qosium Storage.
2.10. Settings #
The last tab is Settings. It allows you to set many things related to the operation of Qosium Storage. The categories are:
- Measurement architecture,
- Heatmap properties, and
- Alert settings.
Further Reading
Heatmap is the most visual element of Qosium Storage, raising performance monitoring of wireless networks to a new level. While the heatmap is at its best when dealing with wireless networks, it can also serve fixed network monitoring since Qosium Probes can be given a fixed location.