
How to Create QoS Heatmaps
When Qosium Probe is involved in measurement having geographical location information, you can visualize all Qosium statistics as a heatmap. This feature is useful when measuring wireless networks to determine the network’s performance in relation to location. Problem areas can be found out quickly, which helps optimize network coverage and initiate recovering actions.
If you are measuring or monitoring moving objects, enable positioning to Qosium Probe, and you will get into the world of heatmaps. This is a very useful way of visualization, allowing you to see the possible problem areas easily. Qosium lets you draw a heatmap of any performance statistic available, enabling QoS heatmaps instead of pure signal heatmaps, as seen typically.
Heatmaps can be drawn with Qosium Scope or Qosium Storage. The philosophy between these two is a bit different. Qosium Storage is typically used for real-time monitoring, while it can also be used to draw heatmaps from stored data of multiple measurements simultaneously. It allows easy separation of different measurements, and e.g., different devices in the field. The customization of the heatmap drawing style, however, is quite limited. Qosium Scope, in contrast, has extensive possibilities in customizing the visualization, but it can, without special actions, visualize only a single measurement at time.
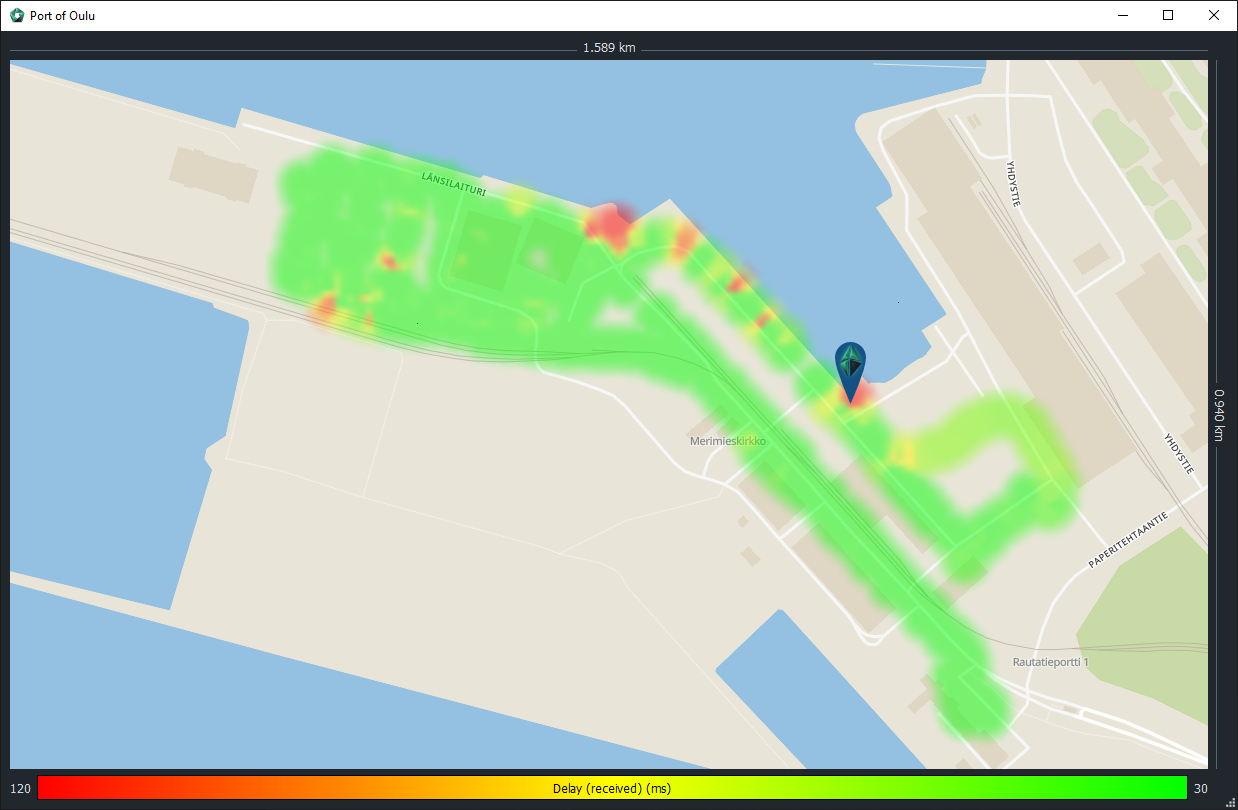
An example of a heatmap visualization snapshot with Qosium Scope is shown above. It is from Port of Oulu while monitoring actual cargo handling daily operations. To start drawing heatmaps with Qosium Scope, see the detailed instructions here.