
Dashboards Tab
Visualizing average results in charts is the most common way to analyze measurement results in Qosium Scope. This can be done in the dashboards tab.
1. Overview #
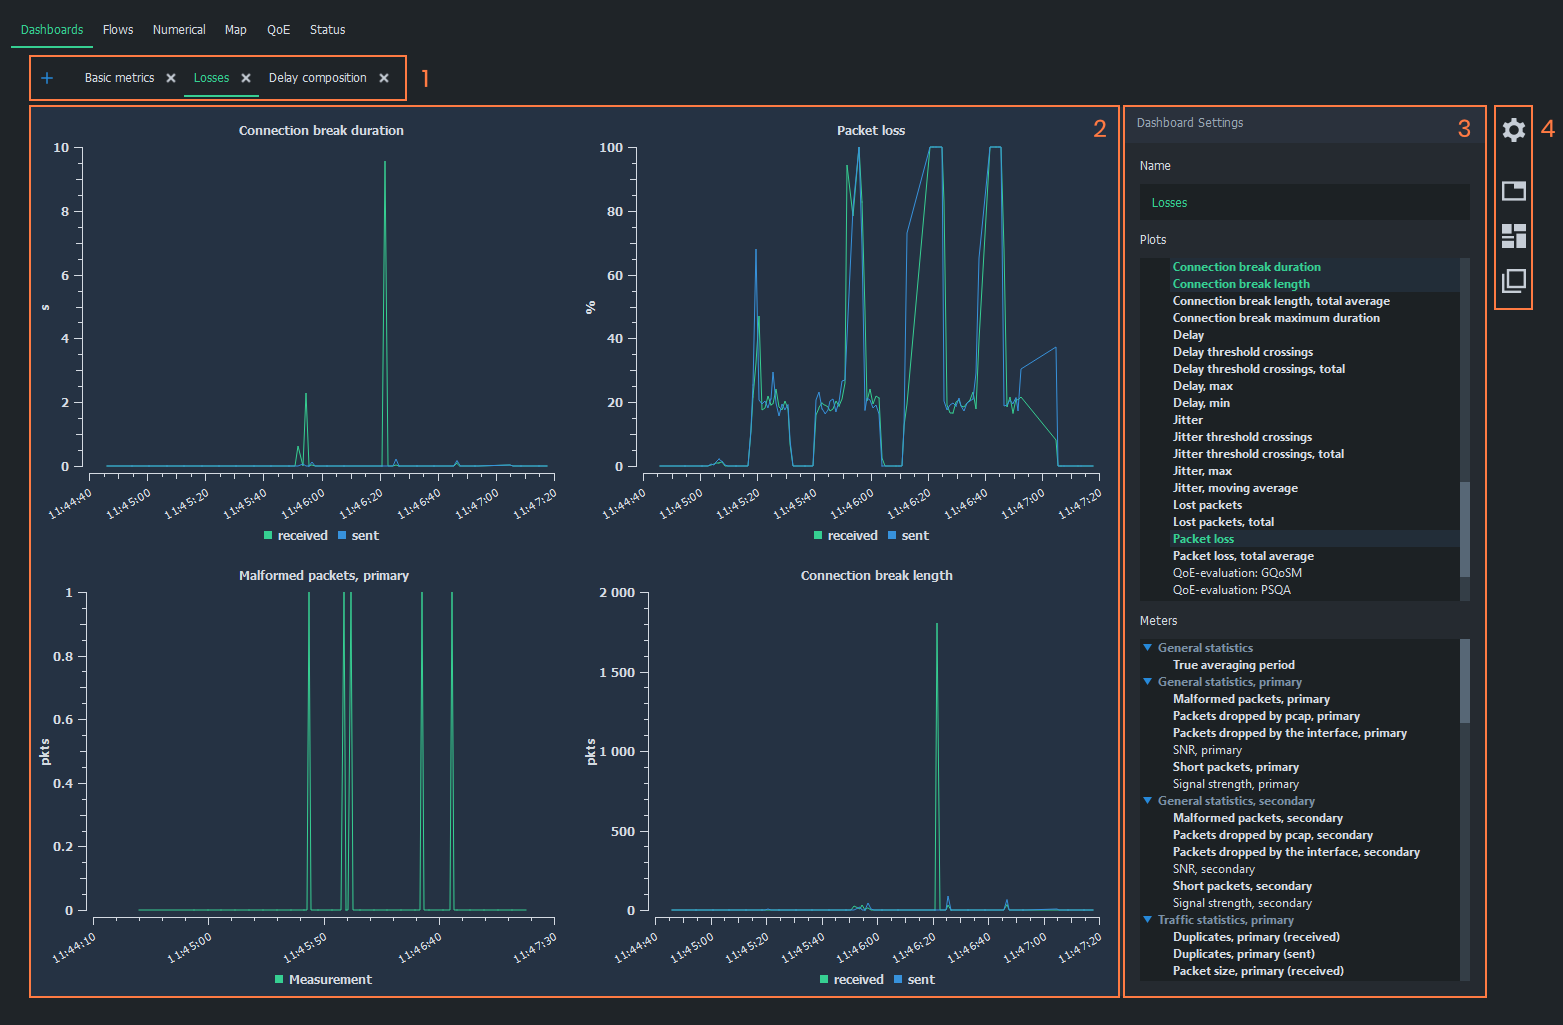
The dashboards tab contains, as the name implies, dashboards. Dashboards visualize average results with plots and charts. Each dashboard has its own tab, and you can freely create, remove, and switch between tabs, even during an ongoing measurement.
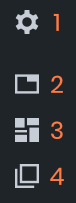
Dashboards tab has four main elements. These elements are further explained in the following sections.
- Dashboard Tabs - List of created dashboards
- Charts Area - Active plots and meters in the current dashboard
- Settings - Settings for the current dashboard
- Toolbar - Quick actions for the current dashboard
2. Dashboard Tabs #
The dashboard tabs panel is used to organize and browse dashboards. In a typical, simple measurement, a single dashboard is sufficient. However, when viewing many various statistics, organizing the charts in multiple dashboards helps keep the interface neat and tidy.
Dashboards can be freely added and removed to allow better organization of measurement results. For example, you can add plots in one dashboard and meters in another. Also, arranging different statistics in their own dashboards is a good option.
- To add a new empty dashboard, click the blue plus-sign on the left side of the tab panel
- To remove an existing dashboard, click the white x next to the dashboard name in the tab panel
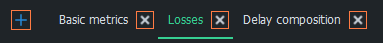
 Removing dashboards does not remove any measurement results
3. Chart Area #
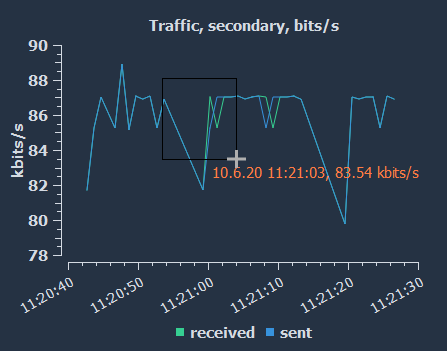
This region of the dashboard shows the opened charts. Each chart represents a single statistic in average results. Some plots have the combined sentUplink / Sent Direction
Refers to a network path direction where traffic is flowing away from the observer towards a remote point. and receivedDownlink / Received Direction
Refers to a network path direction where traffic is flowing from a remote point towards the observer. directions of the same metric.
Plots have a few mouse controls available for viewing the results. Hover cursor over plots lines to inspect values. To zoom, draw a rectangle over the area of interest with the left mouse button. Use the right mouse button to zoom back out.
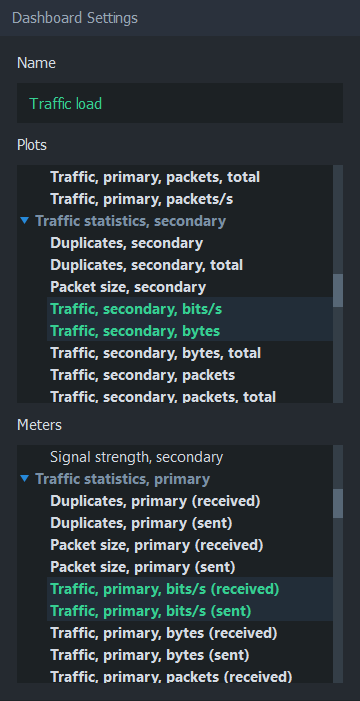
4. Settings #
Each dashboard has its own settings panel, where you can select the charts from two categories: plots and meters. You can also give the dashboard a name, shown in the dashboard tabs panel, for easy recognition.
Use the blue triangles to expand/collapse each statistics group in Plots and Meters lists. Left-click on any statistics to display them immediately in the charts area. To select multiple statistics, press and drag with the left mouse button over the preferred statistics. Statistics, which have results, are marked with bold text. Clicking an active statistic removes the corresponding chart from the chart area.
For more information on each statistic in average results, see Average Results.
5. Toolbar #
The buttons on the right side of each dashboard can be used to control the settings group’s visibility and the arrangement of charts.
- Dashboard Settings - Show/hide Dashboard settings
- Arrange in Tabs - Arrange charts in tabs, where only one chart can be visible at a time
- Arrange in Tiles - Arrange charts in tiles, where charts are stacked in a grid-like format (default)
- Arrange Freely - Move and resize charts manually
Suggested Pages
Qosium has four types of results: Average, flow, packet, and pcap results.
Glossary >
Uplink / Sent Direction
Refers to a network path direction where traffic is flowing away from the observer towards a remote point.
Downlink / Received Direction
Refers to a network path direction where traffic is flowing from a remote point towards the observer.