
Measurement Results in Qosium
Qosium has four types of results: Average, flow, packet, and pcap results.
Contents
1. Overview #
Qosium produces various statistics that can be evaluated in real-time, e.g., with Qosium Scope. The results can also be printed into files for later analysis. During measurement, the results can be injected directly to separate results servers, such as Kaitotek’s Qosium Storage or any software that implements the QMCPQoS Measurement Control Protocol
Kaitotek’s proprietary protocol for controlling measurements and gathering measurement results. Listener interface. Further, if you have implemented the QMCP Controlling interface, you can control Qosium measurements and gather all the results directly in your software.
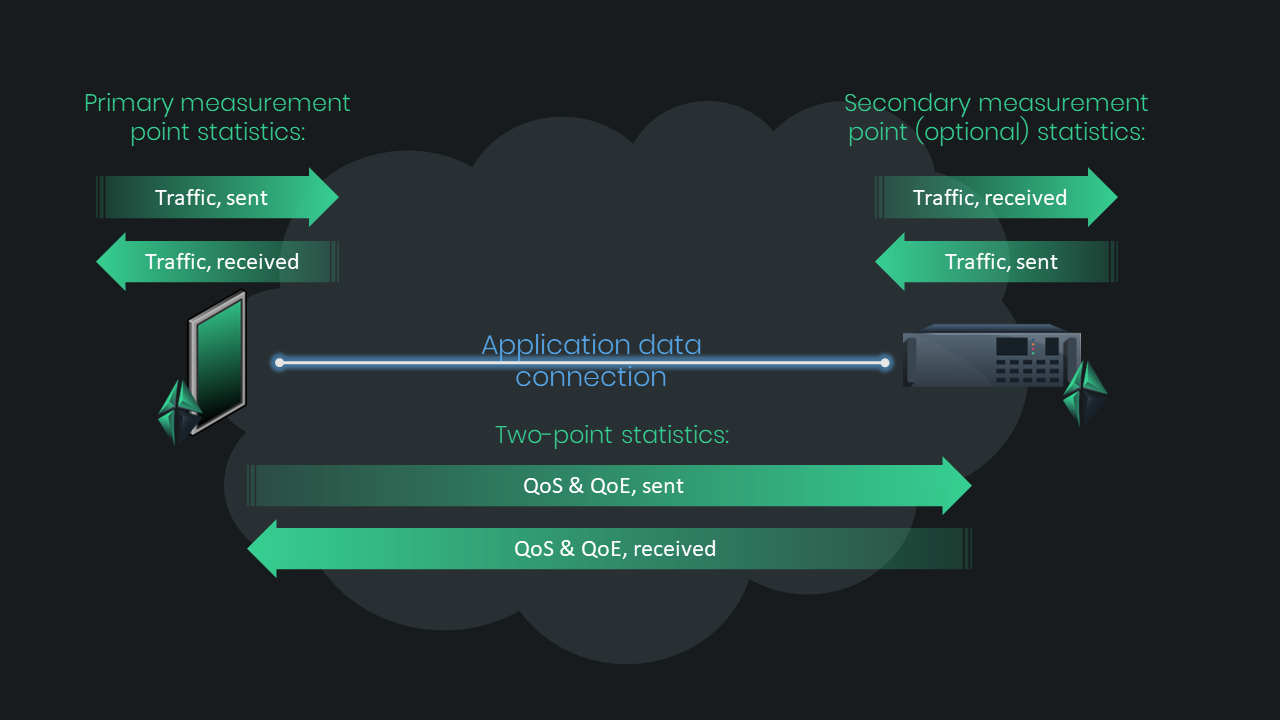
It is important to understand how statistics and their direction are dependent on the measurement points. The figure below opens this a bit. As seen, QoSQuality of Service
Indicates the overall performance of the connection/network and its ability to serve applications. and (QoEQuality of Experience
Indicates the overall performance of a network application, and how user’s experience is affected by the network conditions. statistics are always two-point statistics. Think, for example, delay/latency: network-wise, it does not exist in a single point. Instead, delay tells how long it takes for a data packet to travel from one point to another. In contrast, traffic statistics (and some general statistics and physical layer statistics as well) are calculated in single points only. Bear in mind also that sent traffic for the primary measurement point is received traffic from the perspective of the secondary measurement point.
2. Result Files #
The results file formats are the same between different Qosium components. Thus, e.g., an average results file generated by Qosium Storage can be read and analyzed using Qosium Scope. The only thing to notice is that the results files evolve with Qosium versions. This does not happen often, but sometimes. Thus, sometimes an older Qosium Scope cannot read results files generated using a newer Qosium component. In this case, please ask Kaitotek to update your Qosium.
The results files are in CSVComma-Separated Values
Originally CSV was only about values that were separated by commas, but nowadays the separation mark can also be something else like a semicolon. format, allowing easy import to external statistical tools (e.g., Excel, MATLAB, and R). Absence of a result in a file is notated as N/A.
3. Result Types #
Qosium can produce four types of results:
- Average results - Average results are averaged over Averaging Interval, which is a parameter you can define. The average results constitute the most important statistic set with over 50 specific statistics to be evaluated.
- Packet results - In a two-point measurement, Packet results give accurate QoS statistics for every single measured data packet. They are useful, e.g., in solving flickering QoS problems. In a single-point measurement, these results provide packet basic information.
- Flow results - Flow results give a straightforward view of who is communicating with who, how, and how much traffic there is flowing. Flows consuming high bandwidth are easily detected.
- Pcap results - These results provide you with full packet captures of desired traffic in the popular Pcap format, allowing you further to analyze the details with protocol analyzers such as Wireshark. This is an optional feature.
Most of the Qosium’s statistics are unidirectional, so they are available for received (downlink) and sent (uplink) directions.
 The units of the statistics might be different in different tools (e.g., Scope vs. Scope Lite) and views (e.g., numeric view vs. graphs). There can also be some differences in the statistics’ names depending on where it is used (e.g., real-time visualization vs. results file).
4. Average Results #
4.1. General Statistics #
This category includes general measurement-level statistics that are informative rather than directly related to the networking performance.
| Name | Description | Unit |
|---|---|---|
| Control Packet Number | The number of the control packet (an increasing counter) | Count |
| Measurement Duration | The duration of the measurement. | Seconds |
| True Averaging Period | The true (accurate) averaging period length. Why is there such a value when one has particularly specified, e.g., 1 s averaging interval? In a non-real-time operating system, it is challenging to achieve highly accurate timings if not operating the program in a way that consumes a lot of processor resources. And, while this is not the way Qosium is built, then the true averaging interval will mostly have a slightly different value from the set one. | Seconds |
| Timestamp | The timestamp at the time when the current results were calculated. This value is taken at the Primary Probe. | Unix epoch |
4.2. Single-Point General Statistics #
This category includes single-point general statistics that are Probe-specific.
| Name | Description | Unit |
|---|---|---|
| Malformed packets | The number of packets whose internal structure is not correct. | Packets |
| Malformed packets, total | The number of packets whose internal structure is not correct (total, measurement) | Packets |
| Drops, NIC | The number of interface’s dropped packets during the measurement. Many Pcap versions (e.g., WinPcap) do not support this yet. This is calculated on the Primary Probe side only. | Packets |
| Drops, NIC, total | The same as above, but the total value over the measurement. | Packets |
| Drops, Pcap | The number of Pcap’s dropped packets. NOTE: If this starts to increase, it typically means that the Pcap driver is not able to capture the packets as fast as there is traffic, meaning typically that the computer is running out of resources. This is calculated on the Primary Probe side only. | Packets |
| Drops, Pcap, total | The same as above, but the total value over the measurement. | Packets |
| Location: Accuracy | Accuracy of the current location. | Meters |
| Location: Altitude | Altitude of the current location. | Meters |
| Location: Duration from last update | The age of the last location update. This parameter is handy in checking that the positioning is working correctly. | Seconds |
| Location: Heading | Heading at the current location if the node is moving. | Degrees |
| Location: Latitude | Latitude coordinate of the current location. | Degrees [-90°, 90°] |
| Location: Longitude | Longitude coordinate of the current location. | Degrees [-180°, 180°] |
| Location: Mode | Operation mode of the positioning (Qosium specific): | |
| Location: Speed | Speed of at the current location if the node is moving: | Meters / s |
| Short packets | The number of packets that are too short for analysis. | Packets |
| Short packets, total | The number of packets that are too short for analysis (total, measurement). | Packets |
4.3. Physical Layer Statistics #
This category includes single-point Probe-specific statistics related to the physical layer properties, typically radio interface, including signal performance, cell information, etc. The availability of these statistics is dependent on the platform where Qosium Probe is running.
| Name | Description | Unit |
|---|---|---|
| Base Station MAC address | The current Base Station MAC address (e.g., in WLAN). | String |
| Cell ID | The cell ID of the current mobile network. Note: in the case of 5G-NSA5G Non-Standalone A mobile network technology providing a pathway for 5G New Radio workloads to connect to a 4G/LTE core., the Cell ID is the Physical Cell ID instead of the Cell ID identifying the LTE cell. |
Number |
| Handover events | This statistic can be directly used to show whether or not a handover occurred during the last averaging interval. Currently, if the serving base station has changed during the averaging interval, value 1 is given as an output and 0 otherwise. Multiple handovers during an averaging interval cannot be currently counted. Thus, also, if the device visits another base station but comes back to the earlier one during the averaging interval, this event cannot be yet detected, and zero handovers are given as an output. | Count |
| Network type | The type of the network (e.g., LTE, WLAN, 5G). | Coded value / clear text |
| SINR | The signal to noise and interference ratio at the interface. | dB |
| Signal (RSRP) | The signal strength (Reference Signal Received Power) at the network interface. | dBm |
| Signal (RSRQ) | The signal quality (Reference Signal Received Quality) at the network interface. | dB |
| Signal (RSSI) | The signal strength (Received Signal Strength Indication) at the network interface. | dBm |
4.4. Traffic Statistics #
Traffic information that the single-point measurement can provide includes load, packet sizes, etc. These statistics are available from both primary and secondary Probe.
| Name | Description | Unit |
|---|---|---|
| Duplicates | The observed duplicate packets (based on the packet identification method). | Packets |
| Duplicates, total | The observed duplicate packets as above, but summed over the measurement. | Packets |
| Packet size | Average packet size during the last averaging interval. Note: The packet size means the total size at the link layer, so there is the link-layer header (Ethernet, etc.) also included. | Bytes |
| Protocol | Dominating protocol number in the measured stream. | Protocol number |
| Traffic, bits/s | The traffic load in bits/s (offered load and throughput). | Bits / s |
| Traffic, bytes | The amount of transmitted/received data. | Bytes |
| Traffic, bytes, total | The amount of transmitted/received data summed over the measurement. | Bytes |
| Traffic, packets | The amount of transmitted/received packets. | Packets |
| Traffic, packets, total | The amount of transmitted/received packets summed over the measurement. | Packets |
| Traffic, packets/s | The traffic load calculated in pkts/s (offered load and throughput). | Packets / s |
4.5. QoS Statistics #
QoS statistics are mostly two-point statistics that are calculated for a flow over a network path. They describe the flow’s behavior over the network path and include important statistics like delay, packet loss, etc. Some of the QoS statistics can also be calculated in a single-point measurement for a restricted set of protocols (e.g., RTP and MPEG-2 TS).
All the QoS statistics Qosium produces are one-way statistics between the measurement points.
These statistics are available in a two-point measurement only.
| Name | Description | Unit |
|---|---|---|
| Connection break count | The number of connection breaks during the last averaging interval. | Count |
| Connection break duration | Connection break duration (time-domain) | Seconds |
| Connection break length | Connection break length (packet domain), often as mean loss burst size. | Packets |
| Connection break length, total | As previous, but averaged over the whole measurement. | Packets |
| Connection break maximum duration | The maximum connection break duration in the last averaging interval. | Seconds |
| Delay | Delay (latency) – one-way – as all the QoS statistics, calculated from network interface to another. | Seconds |
| Delay threshold crossings | The number of packets whose delay exceeded the set threshold. | Packets |
| Delay threshold crossings, total | The number of packets whose delay exceeded the set threshold (total, measurement). | Packets |
| Delay, max | The maximum observed sample delay during the last averaging interval | Seconds |
| Delay, min | The minimum observed sample delay during the last averaging interval | Seconds |
| Delay, estimated | This is an estimation, a drift-corrected value, of the delay. It is based on the raw measured delay, but the possible drift of the clocks between the measurement points is strived to be compensated by Kaitotek’s intelligent estimation algorithm. | Seconds |
| Delay samples | The number of Delay samples, i.e., how many values have been used to calculate the QoS statistics | Samples |
| Jitter | The pure delay variation | Seconds |
| Jitter threshold crossings | The number of packets whose jitter exceeded the set threshold | Packets |
| Jitter threshold crossings, total | The number of packets whose jitter exceeded the set threshold (total, measurement) | Packets |
| Jitter, max | The maximum observed sample jitter during the last averaging interval | Seconds |
| Jitter, MA | Moving average jitter (similar as in RTP) | Seconds |
| Lost Packets | The number of lost packets included in the QoS calculation | Packets |
| Lost Packets, total | The number of lost packets included in the QoS calculation (total, measurement) | Packets |
| Packet loss ratio | The ratio of those packets that were lost in the measured network path against all packets | Percentage |
| Packet loss ratio, total | Packet loss ratio (total, measurement) | Percentage |
| QoS samples | The number of packets that were used to calculate the QoS statistics. | Packets |
| Sent info not found | SINFSent Information Not Found This is a special statistic, meaning that a packet was received but was not indicated sent on the other end. is special statistic is, in a way, negative packet loss, meaning that a packet was received but was not indicated sent on the other end. As understood, this is not a normal situation, so having non-zero values here is an indicator of events that should be investigated. See this to understand the possibilities of what is happening. |
Packets |
| Sent info not found, total | The summed value of the previous over the measurement. | Packets |
| Successful packets | The number of successfully transmitted packets included in the QoS calculation | Packets |
| Successful packets, total | The number of successfully transmitted packets included in the QoS calculation (total, measurement) | Packets |
4.6. QoE Statistics #
This category includes higher-level statistics refined typically from the QoS statistics. The Quality of Experience (QoE) is closer to the user’s observations than the pure QoS. These statistics are available only for certain applications.
 While QoE refers to real user tests, the QoE statistics provided here are QoE approximations based on the measured QoS metrics and correlation with measurement data gathered with real user tests.
| Name | Description | Unit |
|---|---|---|
| GQoSM | QoE evaluation by using GQoSM algorithm | MOS (1-5) |
| PSQA | QoE evaluation by using PSQA algorithm | MOS (1-5) |
5. Packet Results #
5.1. Packet Statistics #
These are single-point statistics, giving general information on captured packets. Why not always evaluate full Pcap traces instead, since Qosium also provides them? First, taking Pcap traces from a remote point generates a control load roughly equal to the amount of measured traffic. Getting Qosium’s Packet statistics generates only a fraction of that. The same goes for the required storage space as well. Second, Qosium can be used in sensitive environments, where full packet capturing is not even allowed. In many cases, the general packet information is enough, and full captures are taken only when really needed.
| Name | Description | Unit |
|---|---|---|
| Timestamp | The packet capture time | Microseconds |
| Direction | Indicates whether the packet received or sent from the perspective of the measurement point. | |
| Source Address | The source address (Ethernet, IPv4, and IPv6 addresses currently supported) of the packet | String |
| Destination Address | The destination address (Ethernet, IPv4, and IPv6 addresses currently supported) of the packet | String |
| Source Port | The source port at the transport layer, when available | |
| Destination Port | The destination port at the transport layer, when available | |
| ID | The Identification number of the packet given by the chosen method | |
| Protocol | This indicates the protocol number above the network layer. If the network layer is absent, this indicates the protocol number above the link layer. Standard protocol numbering is used added with some of Qosium’s own definitions. | Protocol number |
| Fragment offset | The fragment offset of the packet, when fragmented at the IPv4 network layer | 8-byte blocks |
| Size | The total size of the packet | Bytes |
5.2. Packet QoS Statistics #
| Name | Description | Unit |
|---|---|---|
| Timestamp | The packet capture time at the sending end | Microseconds |
| Direction | Indicates whether the packet received or sent from the perspective of the primary measurement point. | |
| Source Address | The source address (Ethernet, IPv4, and IPv6 addresses currently supported) of the packet | String |
| Destination Address | The destination address (Ethernet, IPv4, and IPv6 addresses currently supported) of the packet | String |
| Source Port | The source port at the transport layer, when available | |
| Destination Port | The destination port at the transport layer, when available | |
| ID | The Identification number of the packet given by the chosen method | |
| Protocol | This indicates the protocol number above the network layer. If the network layer is absent, this indicates the protocol number above the link layer. Standard protocol numbering is used added with some of Qosium’s own definitions. | Protocol number |
| Fragment offset | The fragment offset of the packet, when fragmented at the IPv4 network layer | 8-byte blocks |
| Size | The total size of the packet | Bytes |
| Delay | The duration of time it took the packet to traverse from one measurement point to another. | Microseconds |
| Jitter | The absolute delay variation between consecutive packets | Microseconds |
| Jitter (MA) | Packet’s delay variation calculated as moving average (similarly as in RTP) | Microseconds |
| Delivery information | Indicates whether the packet was delivered correctly, lost, etc. This information might not be directly available in all visualization tools, but it is present, e.g., in the packet QoS results file (see below). |
In the Qosium results file, the Delivery information is coded as follows:
0- The packet was delivered correctly.1- The packet was lost.- The packet is calculated in the Packet loss ratio statistic.
- Reception timestamp is missing (because the packet was never received).
- QoS values are missing.
2- The packet was a SINFSent Information Not Found
This is a special statistic, meaning that a packet was received but was not indicated sent on the other end. one- The packet is calculated in the SINF statistic.
- The sent timestamp is missing (because the packet was never marked as sent).
- QoS values are missing.
6. Flow Results #
The flow results present captured traffic as conversations between source and destination hosts. What constitutes a conversation is determined by 3 - 5 identifiers:
- Source address (and port, when available)
- Destination address (and port, when available)
- Protocol
When a packet is captured, these identifiers are compared to each existing flow’s identifiers. If none of the flows in the current flow results have the exact same identifiers, then a new flow is created instead. If no packets are detected in the given flow for the duration of the Flow timeout parameter, then Qosium determines that the flow has ended and it is removed.
| Name | Description | Unit |
|---|---|---|
| Source address | The source address (Ethernet, IPv4, and IPv6 addresses currently supported) | string; |
| Source port | The source port (transport layer). 0 is used if the transport layer does not have ports | string; |
| Destination address | The destination address (Ethernet, IPv4, and IPv6 addresses currently supported) | Number; |
| Destination port | The destination port (transport layer). 0 is used if the transport layer does not have ports | Number; |
| Protocol | This indicates the protocol number above the network layer. If the network layer is absent, this indicates the protocol number above the link layer. Standard protocol numbering is used added with some of Qosium’s own definitions. | Protocol number |
| Flow start time | The time when the flow was first registered. | Microseconds |
| Flow end time | The time when the flow was terminated. In results files, N/A is used if the flow had not ended at the end of the measurement. |
Microseconds |
| Flow age | The age of the flow. | Seconds |
| Sent traffic | The amount of sent traffic, reported in different ways in different places. For example, Qosium Scope reports this in real time as bits/s, but in results files, this is the total amount of data (bytes). | Bytes |
| Received traffic | The same as previous but for received direction | Bytes |
| Inactivity | Indicates the duration, how long the flow has been idle (no packets detected). | Seconds |
7. Pcap Results #
Qosium can capture and save full packet captures as Pcap files. While Qosium itself doesn’t have a way to view these files’ contents, they can be opened with any packet analyzer tool that supports a well-known Pcap file format. For more information, see How to Take Packet Capture?.
Glossary >
QoS Measurement Control Protocol
Kaitotek's proprietary protocol for controlling measurements and gathering measurement results.
QMCP is a protocol made by Kaitotek to optimize QoS measurement control communications. TCP is used in the transport layer (currently), but QMCP controls its sessions. All Qosium products use QMCP.
Quality of Service
Indicates the overall performance of the connection/network and its ability to serve applications.
For more information, see our article on Quality of Service.
Quality of Experience
Indicates the overall performance of a network application, and how user's experience is affected by the network conditions.
For more information, see our article on Quality of Experience.
Comma-Separated Values
Originally CSV was only about values that were separated by commas, but nowadays the separation mark can also be something else like a semicolon.
Qosium, for example, uses tabs as separation marks in its CSV-formatted results files.
5G Non-Standalone
A mobile network technology providing a pathway for 5G New Radio workloads to connect to a 4G/LTE core.
Sent Information Not Found
This is a special statistic, meaning that a packet was received but was not indicated sent on the other end.
In a way, this is negative packet loss, which, of course, is an absurd concept as such. Therefore, the continuous appearance of SINF values is often an indication of incorrect parameterization of the measurement. For example, if the packet filter is set too loose, traffic can arrive at the measurement point from other sources than those seen by the peer measurement point. This statistic can also grow occasionally if the QMCP connection between the Probes has too low QoS to stay synchronized with the measurement’s pace. SINF can, however, also occur naturally if the measured traffic content is somehow changed (consider, e.g., video transcoding) between the network path of the measurement points. In that case, the sending side measurement point sees its packets as lost, while the receiving side sees SINF.