
Scopemon Example Configuration
This section presents an example of how to configure Scopemon. It should give an insight into what the configuration file looks like and how it is structured. Most parameters are already set to default values, which are appropriate for most use cases. However, several parameters are almost always required.
Contents
1. Configuration File Contents #
The configuration file used in this example is presented below. We define only a subset of parameters and leave the rest to their default values.
[Application]
admin_tools=true
measurer=1

[ThroughputChart]
received_upper_threshold=10000000
received_upper_alert=true

[ScheduledMeasurer]
schedule_rules\size=2
schedule_rules\1\start_time=8:00:00
schedule_rules\1\end_time=10:00:00
schedule_rules\2\start_time=18:00:00
schedule_rules\2\end_time=23:00:00

[Measurement]
primary_probe_hostname=127.0.0.1
primary_probe_interface_index=2
use_secondary_probe=true
secondary_probe_hostname=192.168.1.236
secondary_probe_interface_index=3
packet_filter=udp port 6889 or udp port 6890
packet_filter_mode=220
write_average_results=true
write_filename_suffix=MyMeasurement
write_path=E:/Measurement Results/
Let’s go through this configuration, piece by piece, in the next sections.
2. Application Group #
Application Group defines the general settings for Scopemon. The most important step in this group is to select the measurer, which controls the measurements autonomously.
[Application]
admin_tools=true
measurer=1
First, we select a scheduled measurer by setting measurer=1. We’ll need to configure it later in its own group. Let’s also select admin_tools=true to enable the control panel window and some other extra privileges. It’s recommended to turn on the admin tools during setup and testing.
3. ThroughputChart #
Let’s assume that we want an alert notification each time the received traffic exceeds 10 Mbps. We set the upper threshold by typing received_upper_threshold=10000000. This alone does not enable alerts; it only expresses that 10 Mbps is the upper boundary to our range of interest. To enable the alert, we type received_upper_alert=true.
[ThroughputChart]
received_upper_threshold=10000000
received_upper_alert=true
4. ScheduledMeasurer Group #
Since we selected the scheduled measurer in our application group, we need to configure it. Let’s assume that we want automatic measurements between 8.00-10.00 and 18.00-23.00. We define 2 rules by assigning schedule_rules\size=2. We issue the start_time and end_time fields to appropriate values for both rules.
[ScheduledMeasurer]
schedule_rules\size=2
schedule_rules\1\start_time=8:00:00
schedule_rules\1\end_time=10:00:00
schedule_rules\2\start_time=18:00:00
schedule_rules\2\end_time=23:00:00
5. Measurement Group #
Regardless of which measurer is selected, the measurement group is always relevant when defining the actual measurement.
[Measurement]
primary_probe_hostname=127.0.0.1
primary_probe_interface_index=2
use_secondary_probe=true
secondary_probe_hostname=192.168.1.236
secondary_probe_interface_index=3
packet_filter=udp port 6889 or udp port 6890
packet_filter_mode=220
write_average_results=true
write_filename_suffix=MyMeasurement
write_path=E:/Measurement Results/
Let’s assume that we want to perform a two-point measurement by using two Probes. Our first Probe is running on a local computer, so we define the hostname as primary_probe_hostname=127.0.0.1. The interface we want to use for capturing has an index of 2. Therefore we define primary_probe_interface_index=2. The same settings must be used for the second Probe, in addition to use_secondary_probe=true.
But we don’t want to capture any traffic, but just certain UDP traffic. For a custom packet filter, we need to set two parameters. First, by typing packet_filter_mode=220, we tell Scopemon that we want to use our own packet filter instead of an auto-generated one. Then we type packet_filter=udp port 6889 or udp port 6890 to capture only UDP traffic going through port 6889 or 6890.
Finally, we write the average results to disk by issuing write_average_results=true. The last parameters define the filename suffix and the write directory.
5.1. Determining Interfaces #
The capture interface index identifies the network interface which is used in the measurement setup. Qosium uses internal indexing for interfaces, which is not the same as the order your OS is displaying. For both the primary and the secondary Probe, capture indexes need to be defined manually. Defining capture interface indexes correctly is vital in configuration, and ignoring these indexes is one reason why measurement configuration fails.
There is no direct way to deduce the index for each interface that Qosium uses. To find out the indexes of interfaces, follow these steps:
- Configure Scopemon as usual
- Assign any number to interfaces indexes, or omit them from the configuration file
- Set
measurerto0so that measurement starts immediately - Set
admin_toolstotrueto access the log page in the control panel window
After following the steps above, launch Scopemon. The log window displays the available interfaces (Make sure Info and Detailed messages are enabled):
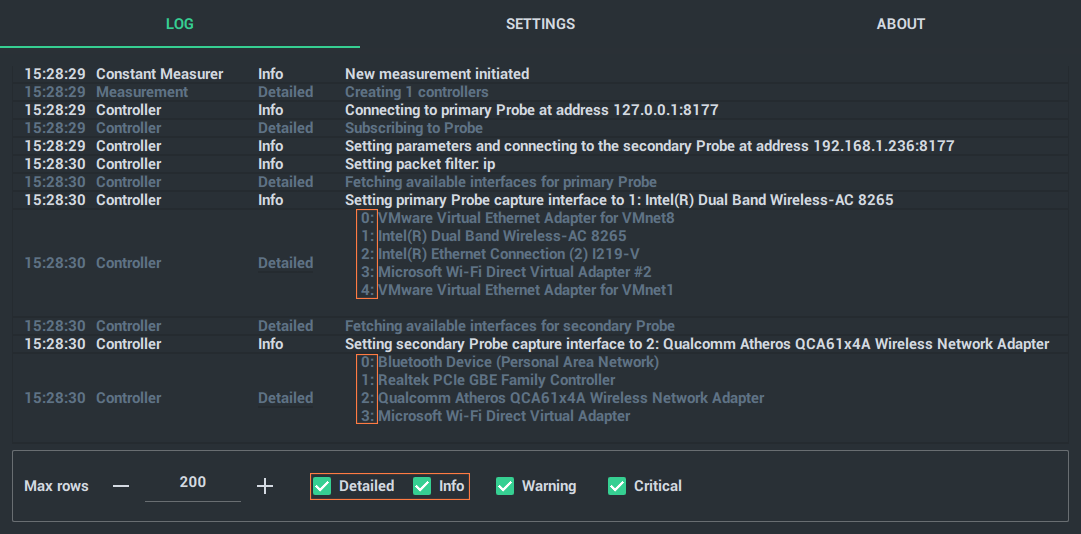
If, for example, we want to use Intel(R) Dual Band Wireless-AC 8265 (index 1) as the primary Probe capture interface and Qualcomm Atheros QCA61x4A Wireless Network Adapter (index 2) as the secondary capture interface, we would update the configuration file with the following information:
[Measurement]
primary_probe_interface_index=1
secondary_probe_interface_index=2