
Scopemon User Interface
The user interface of Scopemon displays results and provides some adjustments for the ongoing measurement. Sometimes there is no need for such local results monitoring. In these cases, the GUI can be left out, and Scopemon handles everything in the background.
Contents
1. Overview #
When the Qosium Scopemon’s GUIGraphical User Interface
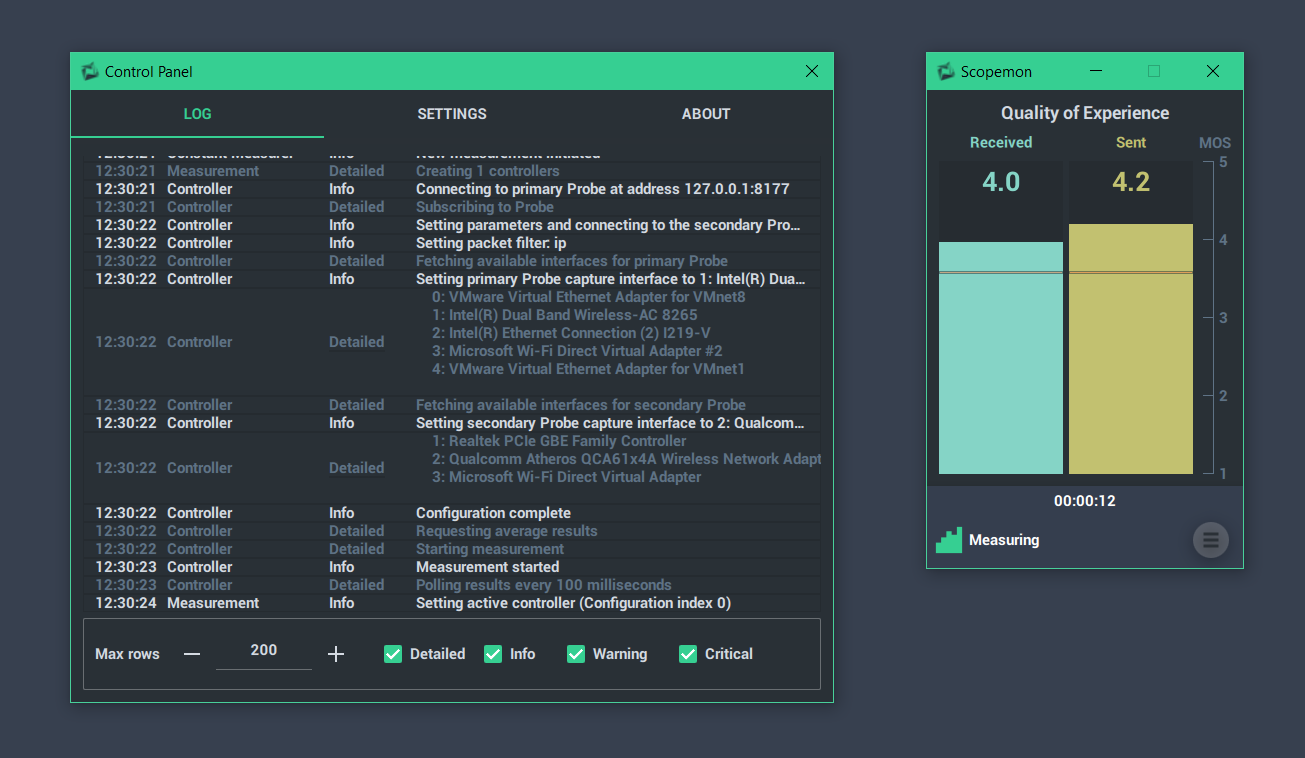
User interface which features graphical elements, such as windows, buttons, dialogs, images, and controls. is enabled, the default interface consists of 2 windows: Main window and Control Panel window. The main window is primarily used to monitor the ongoing measurement, while the control panel window hosts the log, measurement on/off toggle, and information about the Scopemon version.
 The user interface of Scopemon is highly customizable. Therefore, your distribution of Scopemon may have a different appearance, but the basic functionality is nonetheless the same.
2. Main Window #
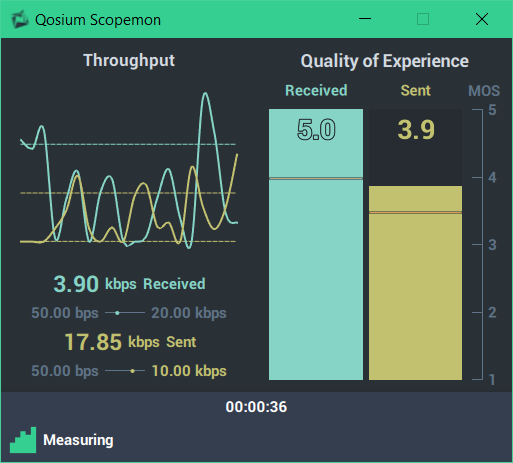
The main window of Qosium Scopemon consists of two elements:
- Charts (top) - One or more charts that visualize given measurement results
- Toolbar (bottom) - This panel displays current measurement duration and status. The menu button shows/hides the Control Panel Window
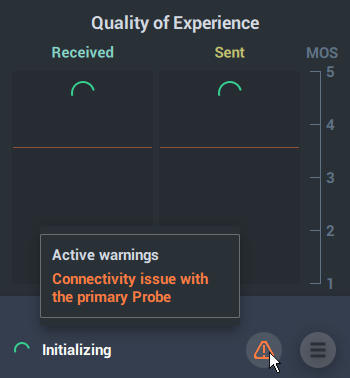
2.1. Warnings #
Scopemon displays some warnings in the main window. These types of warnings usually require user action, be it a misconfiguration or a non-responsive Probe. If Scopemon can deduce that the warning has outlived its usefulness, it will be removed from this list. Some warnings, such as configuration errors, persist until Scopemon is restarted.
Scopemon displays an icon at the bottom of the window (orange exclamation mark inside a triangle) in case of one or more active warnings. Hover over the icon to see the warnings:
A warning can also be used as a trigger for external alerts in a network management solution.
3. Control Panel Window #
The control panel provides a few pages with miscellaneous purposes. See each page in the following section for more information.
3.1. Log Page #
The log page displays a list of events. It reports errors, warnings, and other anomalies in the operation of Scopemon.
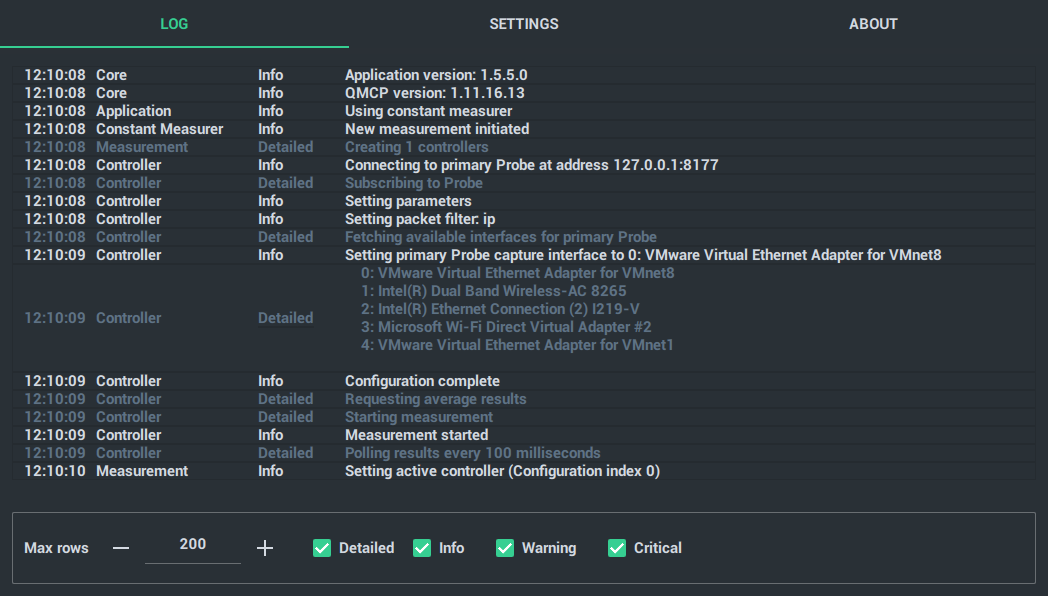
This page has a few settings available:
- Max rows - The maximum number of log messages Scopemon will keep in memory
- Detailed - Show/Hide messages related to operational details
- Info - Show/Hide messages related main operation
- Warning - Show/Hide warning messages
- Critical - Show/Hide critical messages (require actions, typically)
3.2. Settings Page #
On the settings page, the measurement can be turned on/off without closing Scopemon. To learn how to adjust Scopemon settings, see Scopemon Configuration.
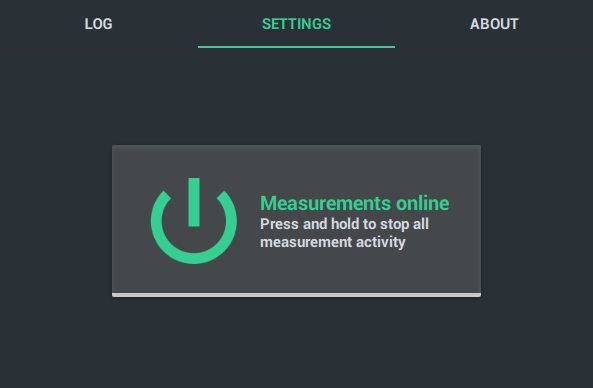
 Using this functionality does not reload the settings from the configuration file. To reload, restart Scopemon instead.
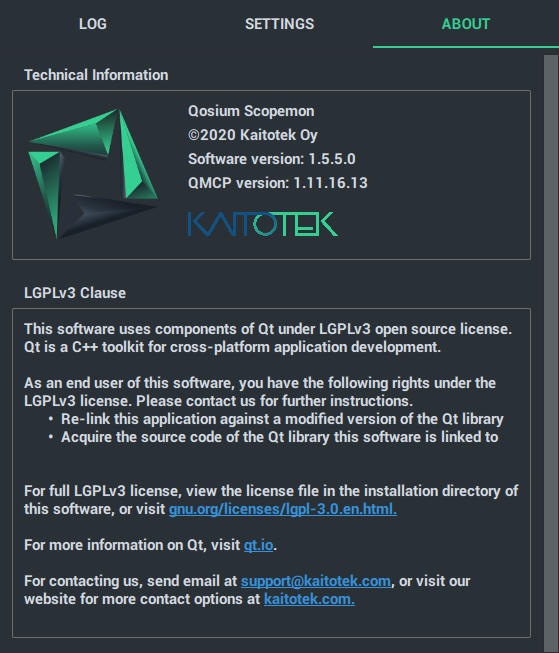
3.3. About Page #
The about page displays technical information about Scopemon, such as version information and additional license clauses.
Glossary >
Graphical User Interface
User interface which features graphical elements, such as windows, buttons, dialogs, images, and controls.