Qosium Scope is a real-time analyzer for managing Qosium measurements. You can use Scope to activate and control Qosium Probes over a network connection. The essential features of Scope are measurement parameterization, running measurements, results collection, and results visualization. Qosium Scope is an excellent tool for manual QoS and QoE measurements.
Overview
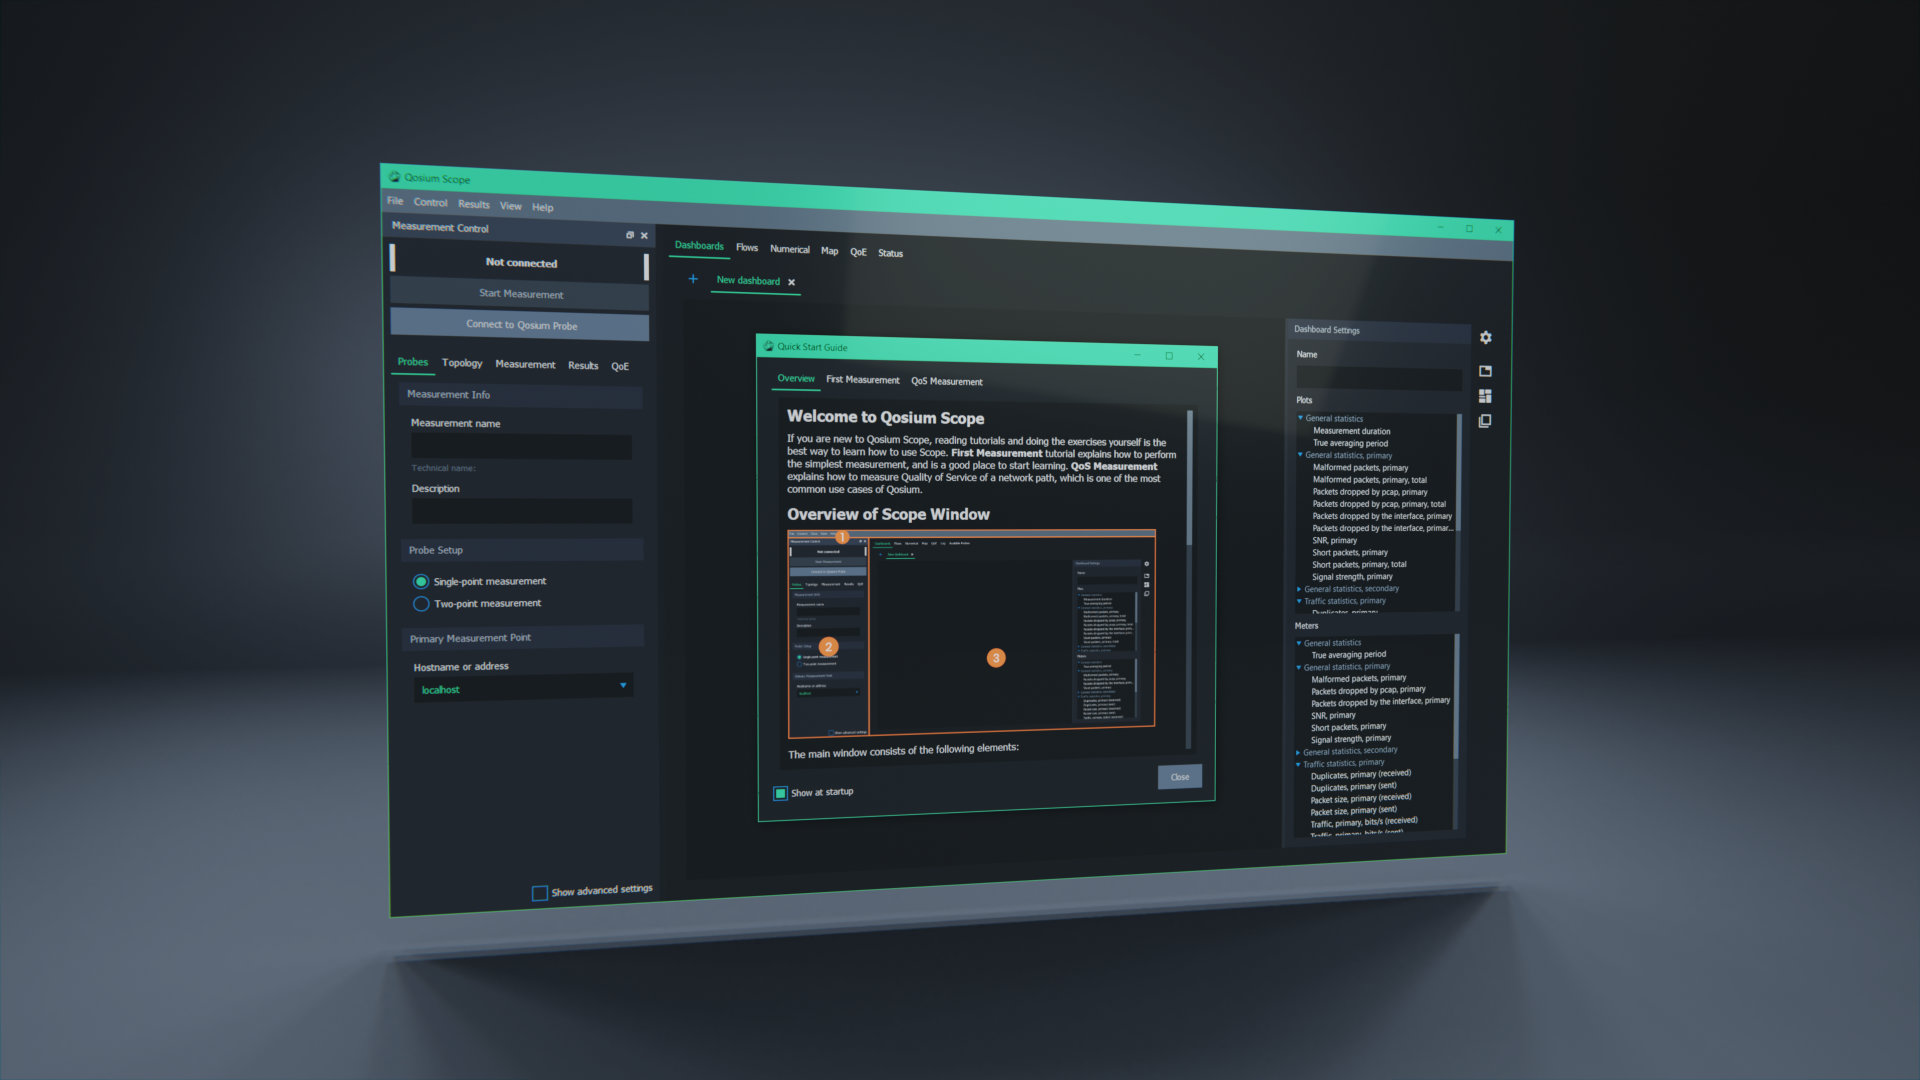
Qosium Scope is a desktop application for performing Qosium measurements and analyzing results. Scope is a comprehensive analyzer software on passive QoS/QoE measurement. Its capabilities range from measurement parameterization and control to results visualization. With Scope, all features of Qosium measurements are at your fingertips.
Scope is a measurement controller, so it does not perform measurements itself but instead controls Probes for actual measuring.
Parameterization
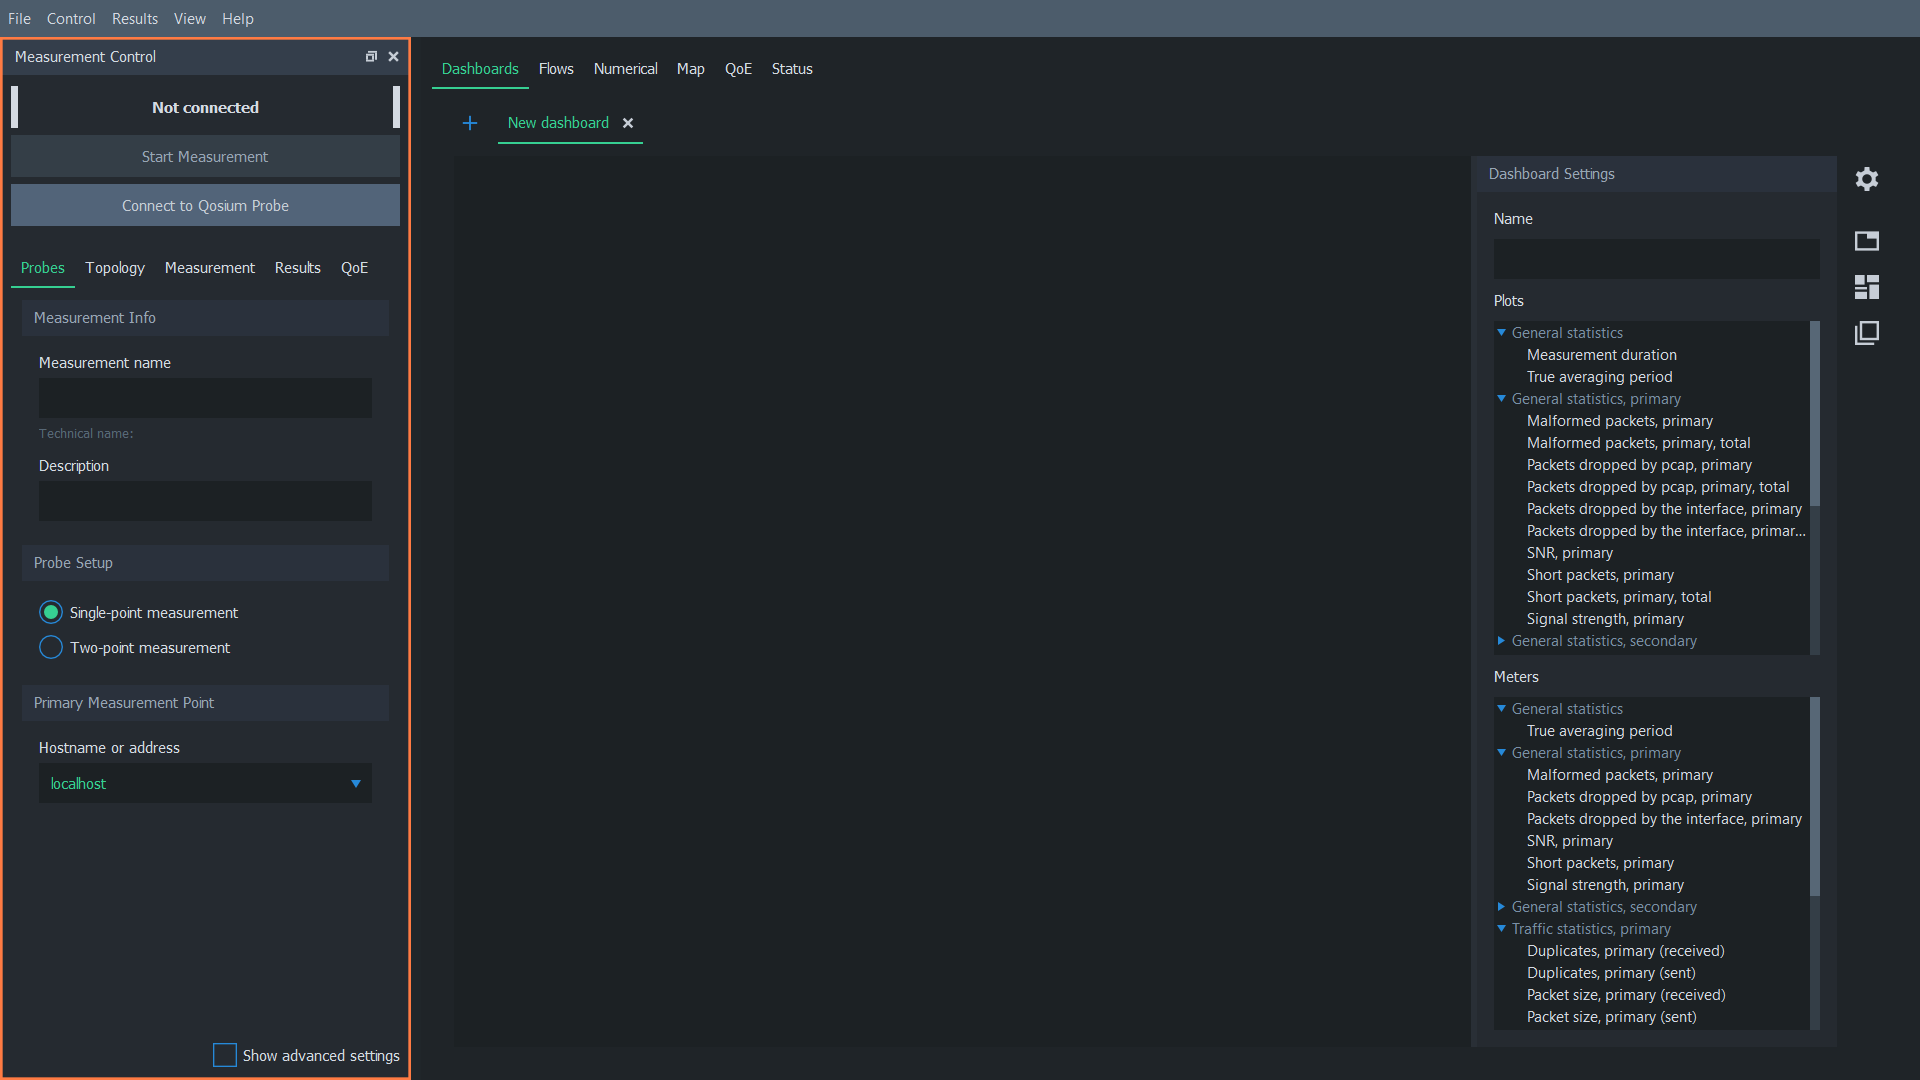
Qosium Scope comes with an extensive set of parameters to configure measurements. However, parameterizing a typical measurement is straightforward. It’s only a few settings you need to touch in most cases. All the parameters and visualization settings can be, naturally, saved, making it easy to return to an earlier measurement.
Results Analysis
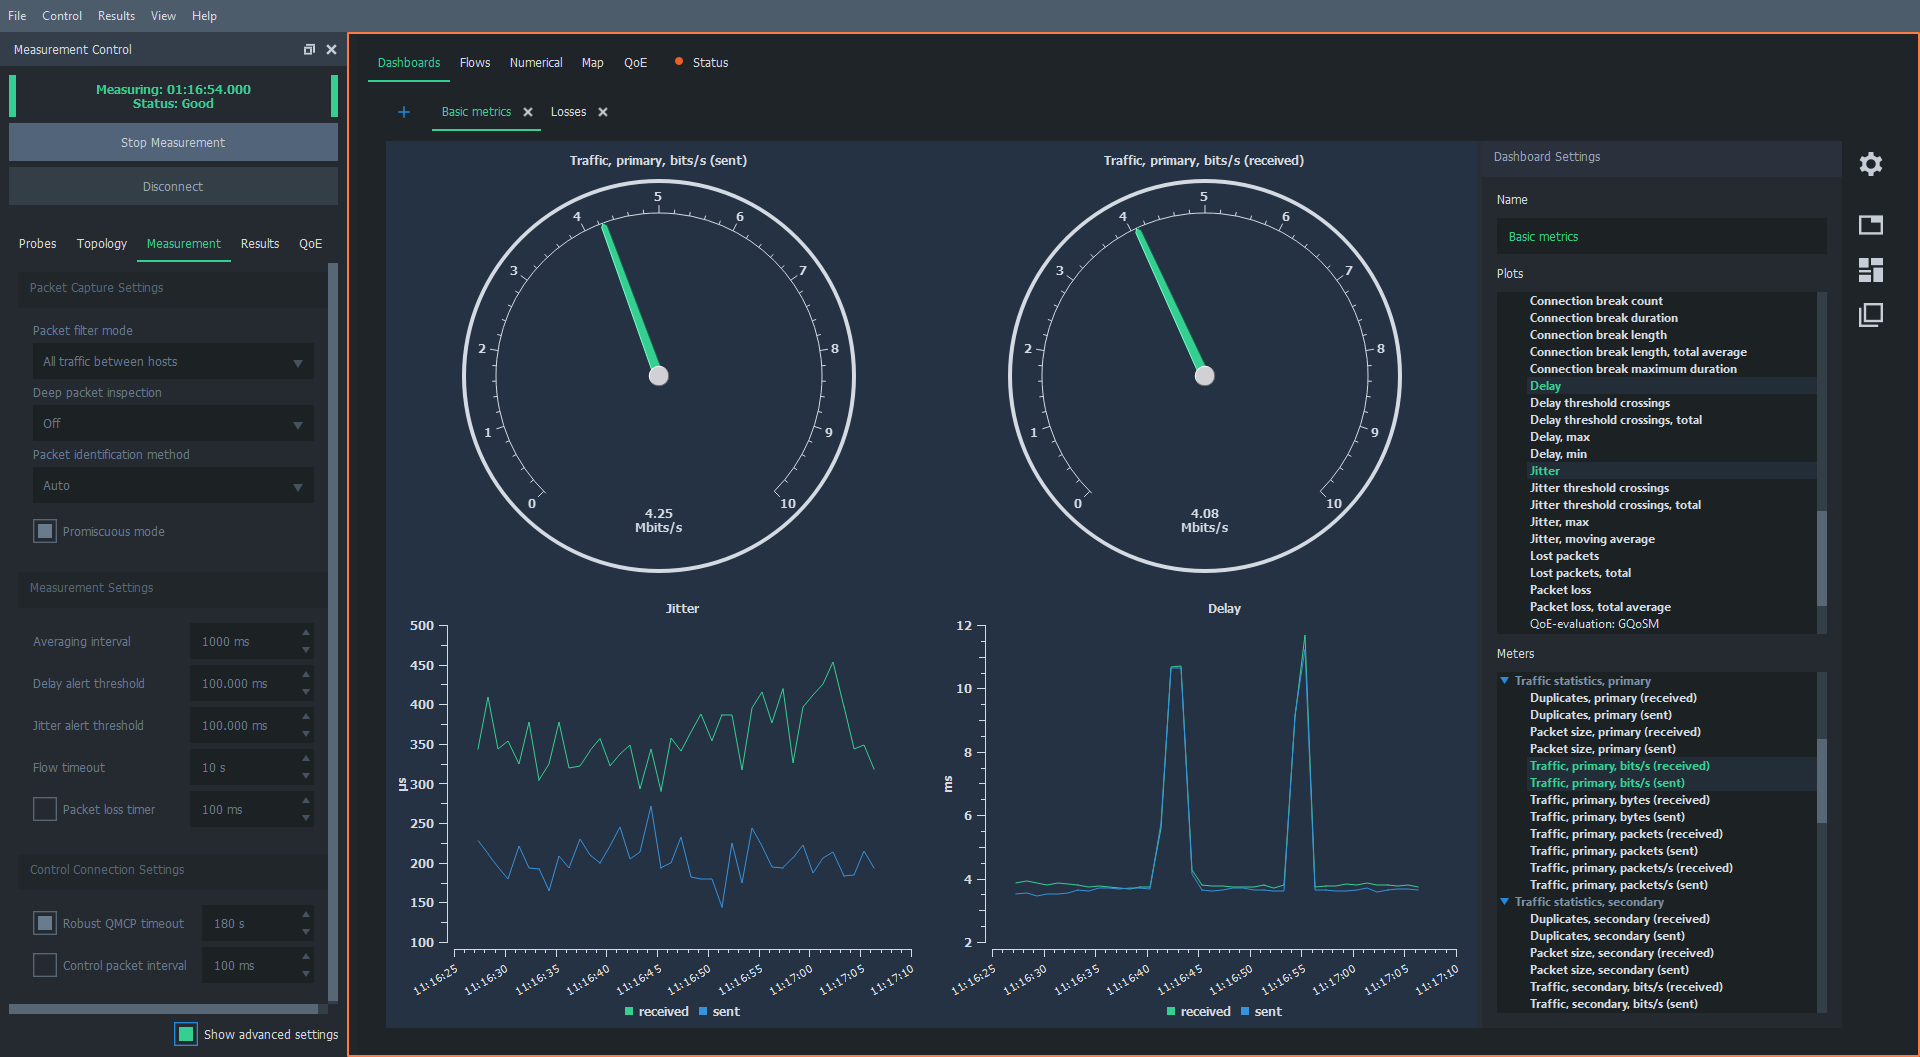
Measurement results can be visualized in multiple ways. Meters, graphs, bars, and numerical formats, it’s up to you how you want to take a look at results, and which results. Visualized results are averaged over the desired time period. However, from average results, you can drill into packet results where QoS results for every single packet is shown.
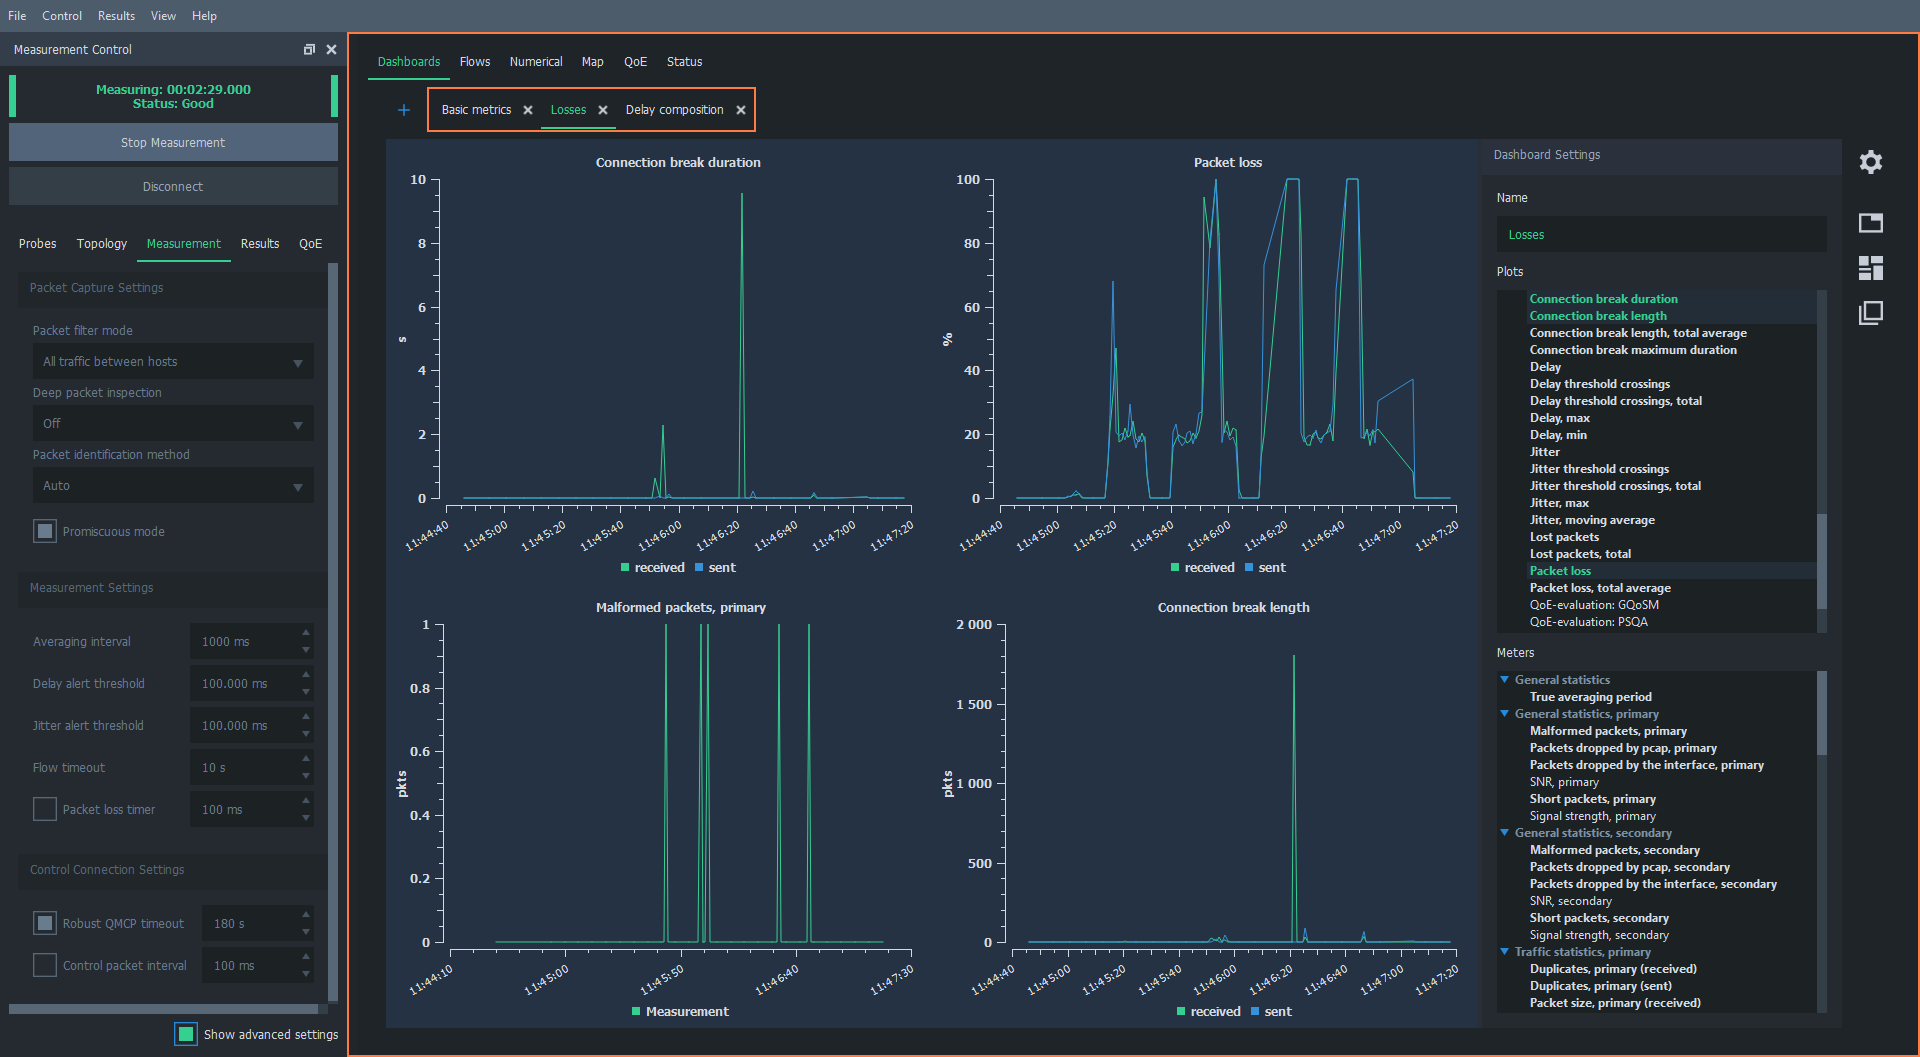
Graphs let you see how results have developed over time. Meters, on the other hand, allow you to see the current situation. Results like delay, jitter, traffic load, packet loss, and over 20 other measures are measured and visualized always to both directions.
Changing between different visualization types and creating your dashboard views is easy. You can select the measures for visualization freely and name the dashboards as you wish.
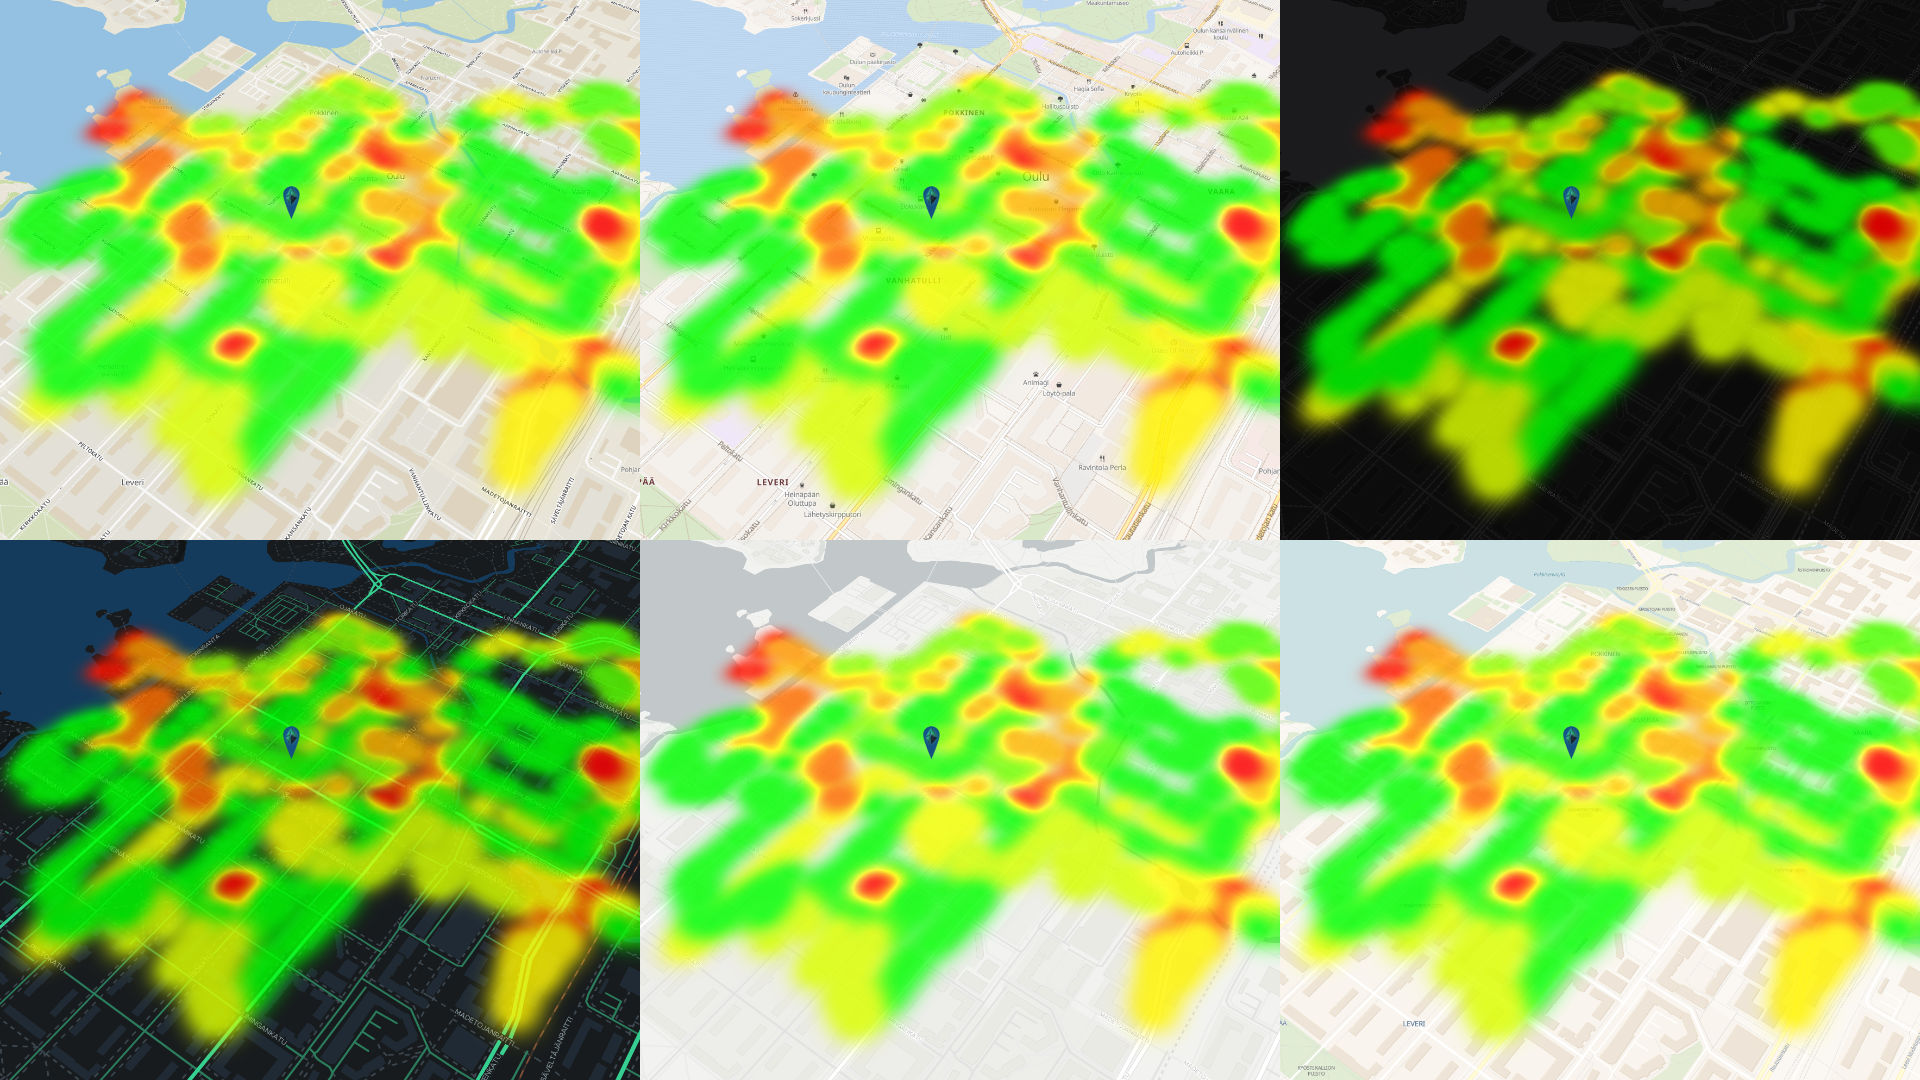
QoS heatmap is perhaps the most elegant feature of Qosium Scope. If Qosium Probe has location information during a measurement, Qosium Scope allows visualizing any measure (for example, delay) on a map even in real time. Qosium Scope makes it possible to find out the coverage area of a wireless network, not in terms of signal strength but terms of the actual quality experienced by end-users.
It is possible to also bring your own overlay images to Qosium Scope’s map. The image can be, for example, a building layout for indoor wireless measurements. Satellite positioning doesn’t work well indoors, but location information can also be given by clicking a mouse, or by using some other positioning technique.
Heatmap visualization can be parameterized to satisfy your needs. This includes, for example, ruling color coding, defining drawing precision, and selecting map style.
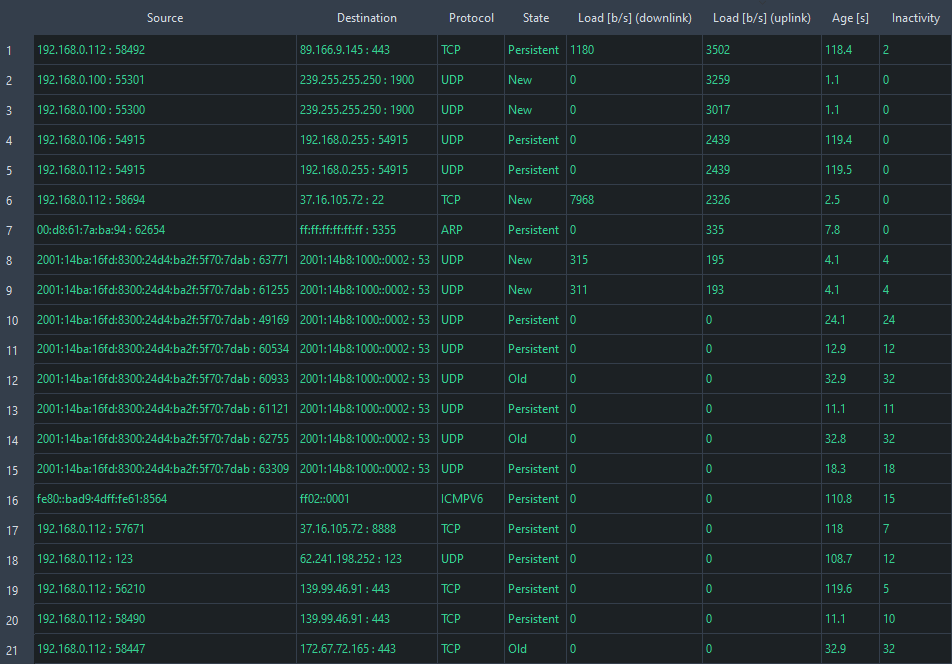
In addition to QoS results, Qosium Probes extract overall network traffic to traffic flows. Flow analysis in Qosium Scope shows which network devices talk with whom through the node Qosium Probe is running. It is also a simple way to recognize if interesting applications are traversing the Probe node.
Storing the Results
All measurement results can be saved to a file, which can later be loaded back to Scope or taken quickly to other analysis tools. The results can also be sent to a database, such as Qosium Storage, in real time.
Qosium can also take packet captures from the traffic being measured. This is an optional feature, which can also be left out entirely from a build if desired. A pcap file is generated, which can be taken, for example, to Wireshark for accurate protocol analysis. Packet capture is taken from the Layer-2 level, which ensures that also MAC layer protocol headers are included.

 Scope is a measurement controller, so it does not perform measurements itself but instead controls Probes for actual measuring.