
We’ve revamped Qosium’s traffic flow analysis. Now, you can quickly and clearly see whether your network’s traffic flow profile matches your expectations, both in real time and historically.
March 17th, 2026
While measuring data transfer speeds at network interfaces is straightforward, understanding what forces shape your traffic is more complex: Which devices are communicating, where, how, and what volumes of data are being moved? It’s essential to know exactly what’s flowing through your production networks. Sometimes, an application or service may malfunction and start generating excessive, unnecessary traffic, disrupting the entire network. Monitoring traffic also has a strong cybersecurity perspective: Are there flows that shouldn’t be there? If there’s been even a short-term hole in the firewall, did some application manage to exploit it? Detecting and recovering from such situations quickly is a top priority.
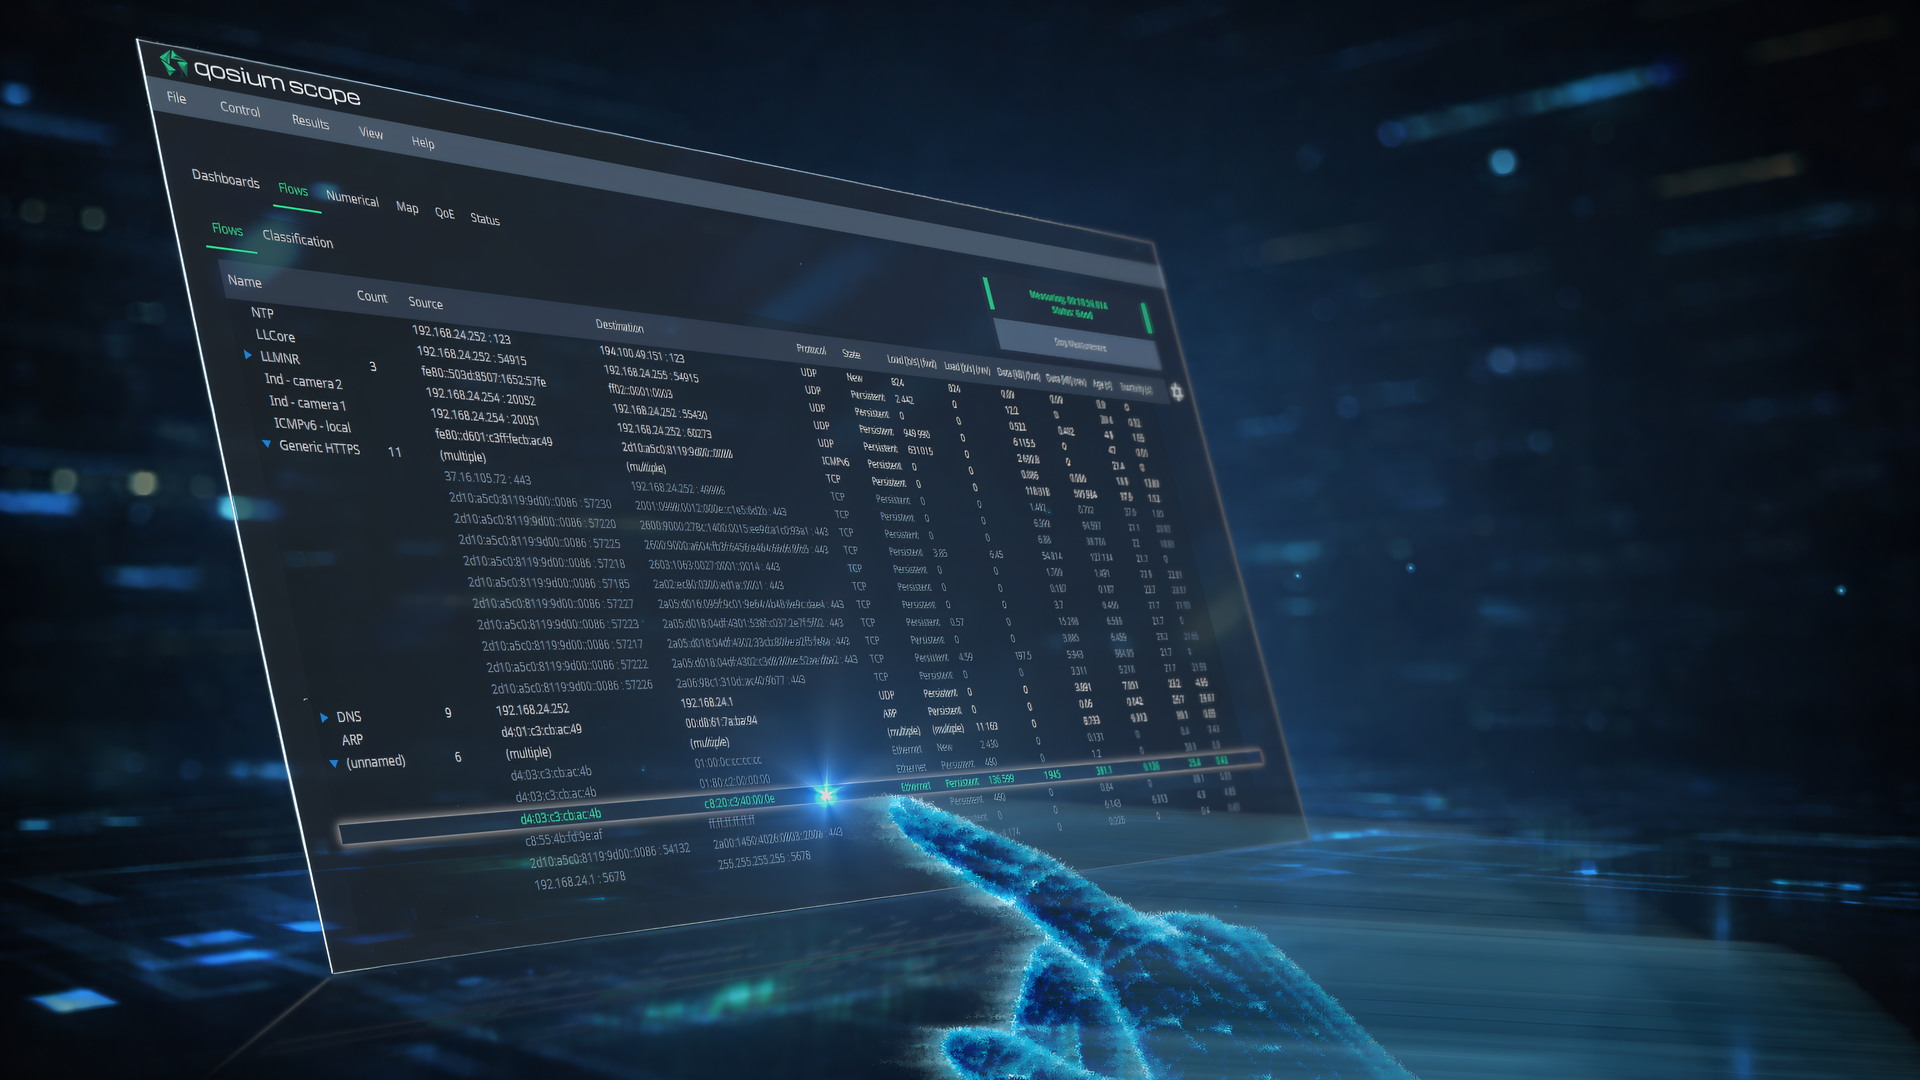
Our updated flow analysis makes traffic monitoring easy. You can analyze traffic flows from any measurement point in your network in real time. You can classify traffic based on your own criteria, grouping flows under custom names. At a glance, you’ll see the profile of traffic passing through a device, and any unknown traffic is immediately revealed.
Historical data is included, too. When you spot a spike in your data transfer speed meters, you can go back to that exact moment and see which traffic flows caused it. Traditionally, this has required heavy packet captures and time-consuming manual work.
What started as a simple flow view in Qosium Scope has evolved into a full-fledged analysis tool within the measurement tool. At the same time, we’ve brought the updated flow analysis to Qosium Storage, enabling continuous, network-wide monitoring.